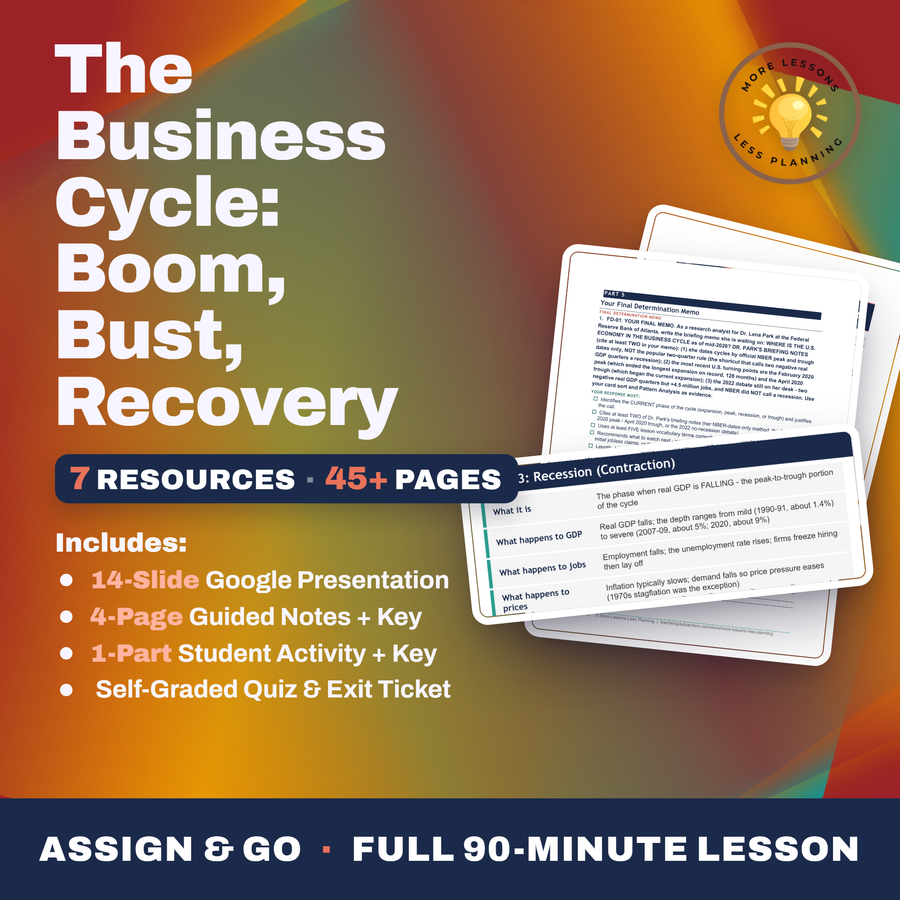

The Business Cycle Boom, Bust, Recovery
Quality reviewed September 2026
- Grades
- Grades 9-12
- Time
- About two 50-minute class periods
- Includes
- 11 ready-to-teach files
- Format
- Word (.docx) · PowerPoint (.pptx)
- Slide deck
- Guided notes
- Guided notes teacher key
- Activity + answer key
- Quiz + answer key
- Exit ticket + answer key
- Teacher guide
- Teacher presentation notes
What students do
- Sort real U.S. moments, including February 2020 and April 2020, into expansion, peak, recession, and trough
- Calculate the average length of U.S. expansions against recessions to see which one actually dominates the record
- Match three historical recessions, 1973 oil shock, 1981-82 Volcker tightening, and 2007-2009, to the shock type that caused each
- Classify variables like GDP, corporate profits, and the unemployment rate as procyclical, countercyclical, or acyclical
What it covers
- The four-phase business cycle vocabulary, expansion, peak, recession, trough
- Real dated U.S. turning points, including the February 2020 peak and the two-month April 2020 recession
- Matching three historical recessions, the 1973 oil shock, 1981-82 Volcker tightening, and 2007-2009, to their causes
- Classifying GDP, corporate profits, and the unemployment rate as procyclical, countercyclical, or acyclical
Learning targets
- Identify the four phases of the business cycle (expansion, peak, recession, trough/recovery)
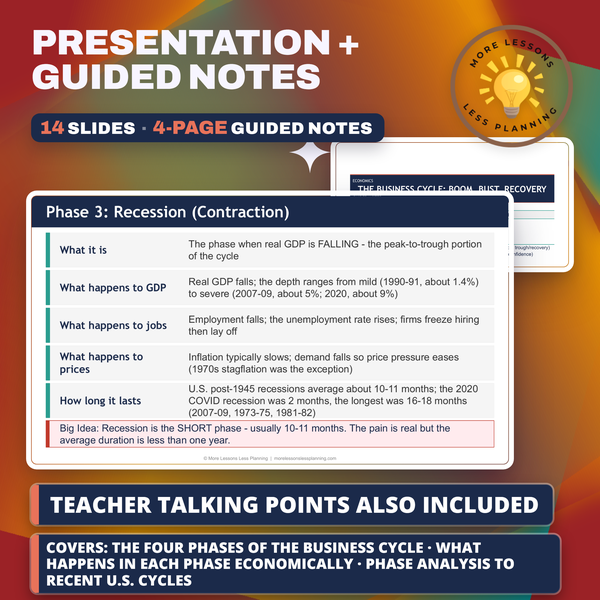
- Describe what happens in each phase economically (GDP, jobs, prices, confidence)
- Apply phase analysis to recent U.S. cycles and the years 2018-2026
Peek inside
Four Phases, One Wave
Expansion: real GDP rising
Peak: the highest point
Recession: real GDP falling
Trough: the lowest point (then recovery)
Four Phases, One Wave Around a Trend
The four phases of the business cycle are expansion, peak, recession, and .
During expansion, real GDP is .
The PEAK is the point of activity.
During recession, real GDP is .
The cycle oscillates around a long-run growth line.
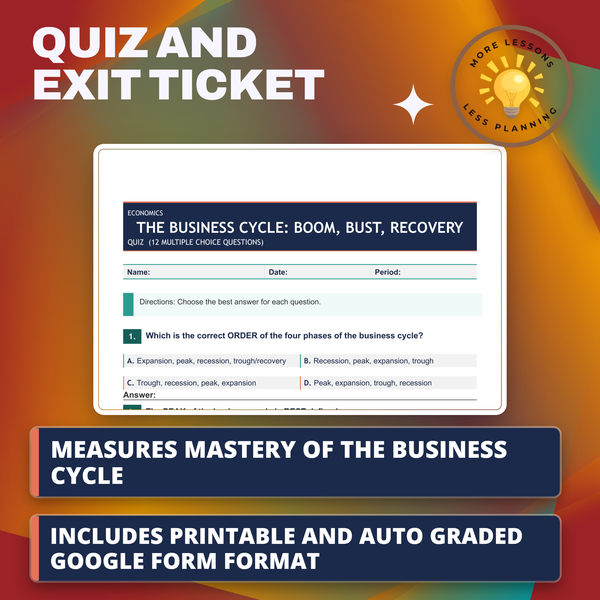
1. Q1. The phase of the cycle when real GDP is rising, jobs are being added, and incomes are climbing is called .
Why this matters
Ask a class whether the economy is in a recession right now and the guesses scatter in every direction, because most students share no vocabulary for what a recession is. This lesson gives them expansion, peak, recession, trough, then has them sort real U.S. moments into it, including the February 2020 peak that ended a 128-month expansion.
Students walk out with a longer view once they compute the average length of an expansion against a recession themselves and see how heavily the record favors growth over collapse. I close by matching three real recessions, the 1973 oil shock, the 1981-82 tightening, and 2007-2009, to the shock behind each.
From one teacher to another
Ask a class "are we in a recession right now" and you get twelve different guesses with no framework behind any of them, so this lesson builds the four-phase vocabulary first: expansion, peak, recession, trough. Students sort real dated U.S. moments into those phases, including the February 2020 peak that ended the longest expansion on record at 128 months and the April 2020 trough that followed a recession lasting just two months, the shortest ever recorded. The math is what sticks longest though: students calculate the average length of an expansion against the average length of a recession themselves, and the gap is what reframes every "the economy is collapsing" headline they'll read afterward, and they finish by matching three real recessions to the specific shock that caused each one instead of treating all downturns as interchangeable.
Every file in this toolkit
-
Activity (Student)
Analyst work for Dr. Lena Park has students sort late-2010s growth, the pandemic-era peak, and the shortest U.S. recession on record into cycle phases, then compare the record 128-month expansion to shorter averages before a Federal Reserve Bank of Atlanta memo.
-
Activity (Answer Key)
Card rulings in this key match 1973's oil shock, 1981-82's Volcker tightening, and 2007-2009's housing crash to supply, monetary, and financial causes, then classify GDP as procyclical and the jobless rate, which hit 14.7 percent in April 2020, as countercyclical.
-
Exit Ticket (Student)
Three questions order the four phases of the business cycle, weigh how much longer a typical U.S. growth stretch runs than a downturn since 1945, and identify what the April 2020 NBER trough date represents. All four phases need naming in order, with one fact about each.
-
Exit Ticket (Answer Key)
Expansion, peak, recession, and then trough gives the correct order, roughly 10 to 11 months is the average U.S. downturn against 64 months of growth, and the low point right before the next expansion began is what the April 2020 trough marks. No point rubric rides along here, just a teacher's read.
-
Guided Notes (Student)
Real U.S. moments get sorted into four phases, a 2020 high point that closed a 128-month run of growth, then the shortest recession on record at just 2 months, before three named variables get placed along the cycle, one rising with growth, one moving against it, one barely tracking it.
-
Guided Notes (Teacher Key)
Average lengths get supplied on both sides, expansions running about 64 months against recessions of only 10 to 11 months, then the notes explain why unemployment is the classic countercyclical variable that keeps climbing for months after a trough passes.
-
Quiz (Student)
Real U.S. moments get sorted across the four business-cycle phases, a 1973 oil shock gets matched to its shock type, and the length of an average expansion gets compared to an average recession.
-
Quiz (Answer Key)
The record-length expansion runs 128 months, 2020's recession stands as the shortest on record and one of the deepest, and unemployment reads as a countercyclical indicator.
-
Slides
NBER's dated turning points put the expansion's finish line in February 2020 after 128 months, right next to the two-month contraction that followed, then a chart works out why average expansions run 64 months against an average recession of just 10 to 11.
-
Teacher Guide
A FRED watchlist has students plot real GDP, payrolls, the unemployment rate, and the yield curve spread back to 1980 and mark which NBER recession bars they can explain. Discussion work asks why the bureau waited 13 months to announce the 2009 trough.
-
Teacher Presentation Notes
A 128 month expansion ending in February 2020 gets its own card, matched a few cards later by a recession that lasted just two months, framed so a class has to decide which phase actually dominates the record.
Download
Where should I send the next one?
Everything here is free and it stays that way. Leave your email and I'll send you the new lessons as they go up. You can unsubscribe from any one of them.
Related resources

Consumer Confidence Why It Predicts the Future
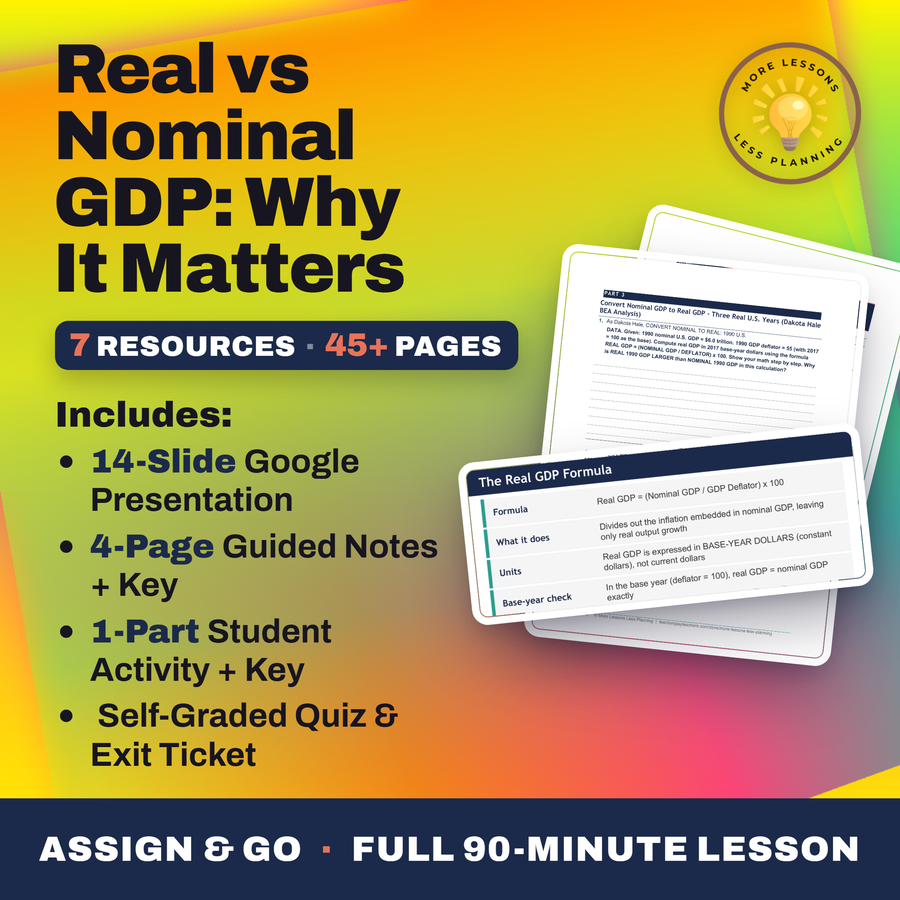
Real vs Nominal GDP: Why It Matters
Recession Compared 2008 vs 2020 vs 2024
Unemployment Rate: How It's Calculated
Amazon Warehouses: Working Conditions Investigation

Anti-Trust Laws and Regulation: Promoting Fair Competition
Every lesson on this site is free to download and use. If one of them saved you a prep period, you can chip in a few bucks toward my three kids' daycare fund. That's genuinely where tips go.