The Business Cycle Boom, Bust, Recovery
Teacher Guide
A FRED watchlist has students plot real GDP, payrolls, the unemployment rate, and the yield curve spread back to 1980 and mark which NBER recession bars they can explain. Discussion work asks why the bureau waited 13 months to announce the 2009 trough.
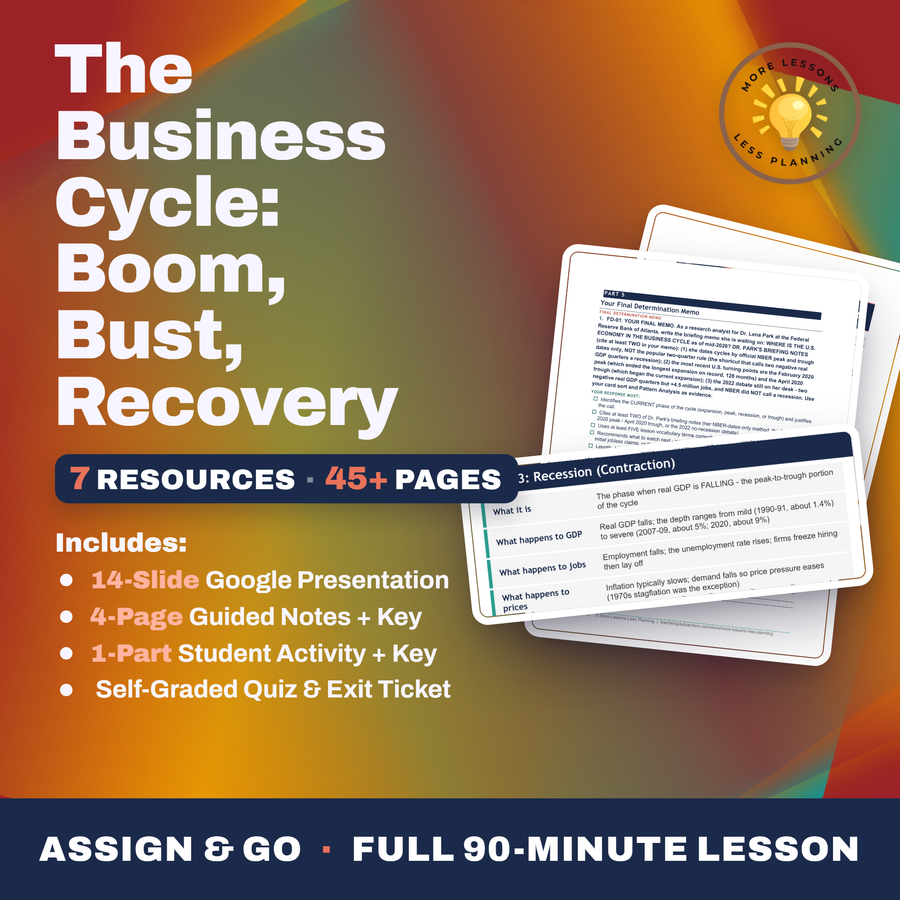
Download the Teacher Guide
Word (.docx)
Where should I send the next one?
Everything here is free and it stays that way. Leave your email and I'll send you the new lessons as they go up. You can unsubscribe from any one of them.
Did this save you a prep period? You can chip in toward my three kids' daycare fund. Everything on this site stays free either way.