Consumer Confidence Why It Predicts the Future
Quality reviewed September 2026
- Grades
- Grades 9-12
- Time
- About two 50-minute class periods
- Includes
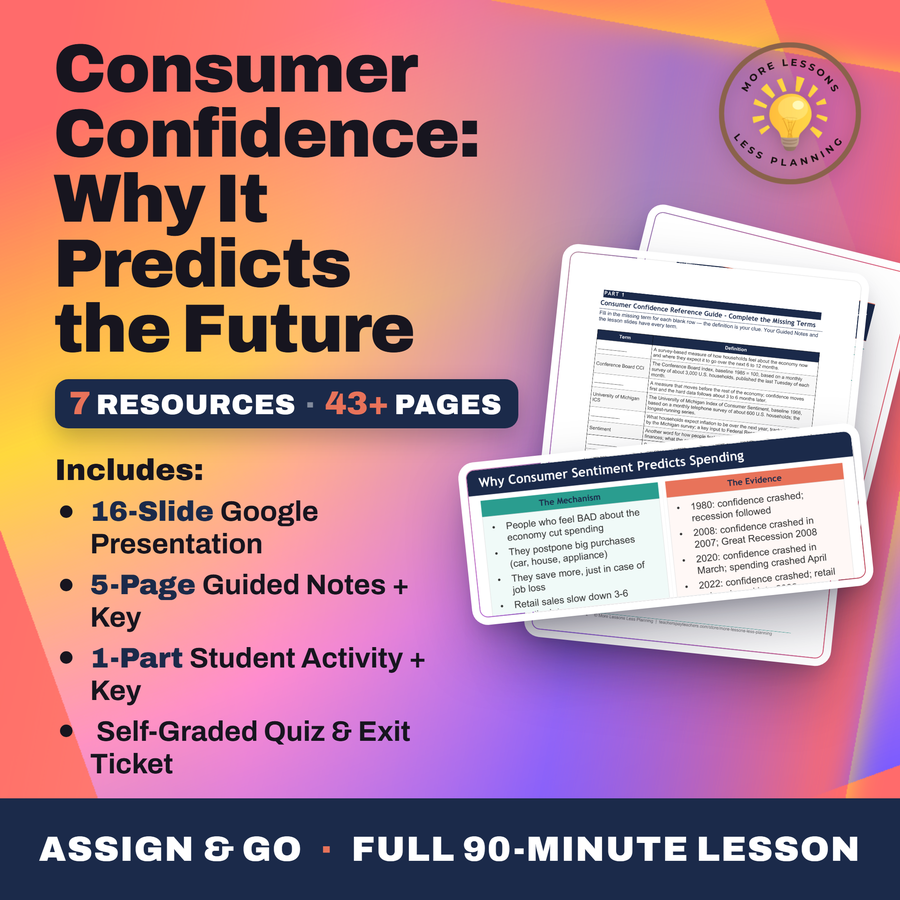
- 11 ready-to-teach files
- Format
- Word (.docx) · PowerPoint (.pptx)
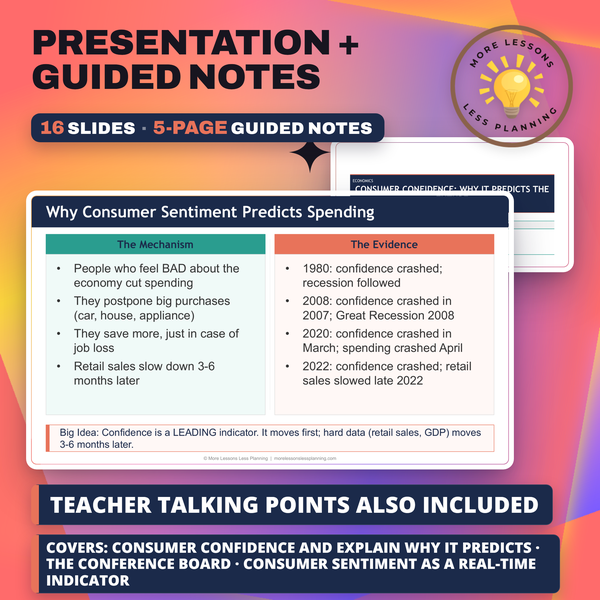
- Slide deck
- Guided notes
- Guided notes teacher key
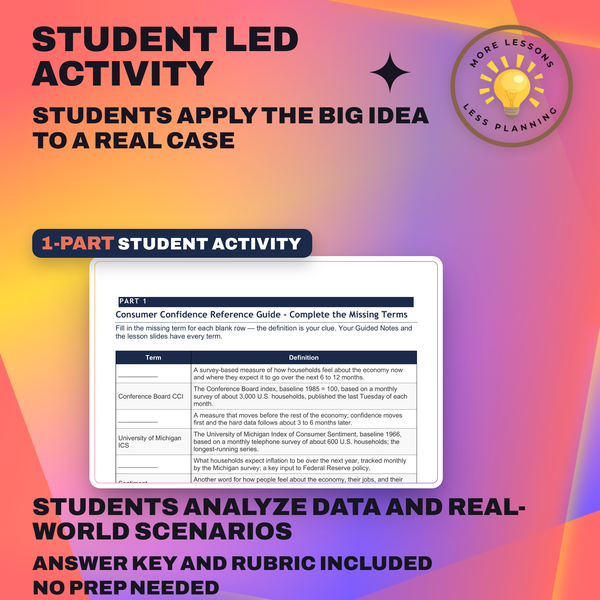
- Activity + answer key
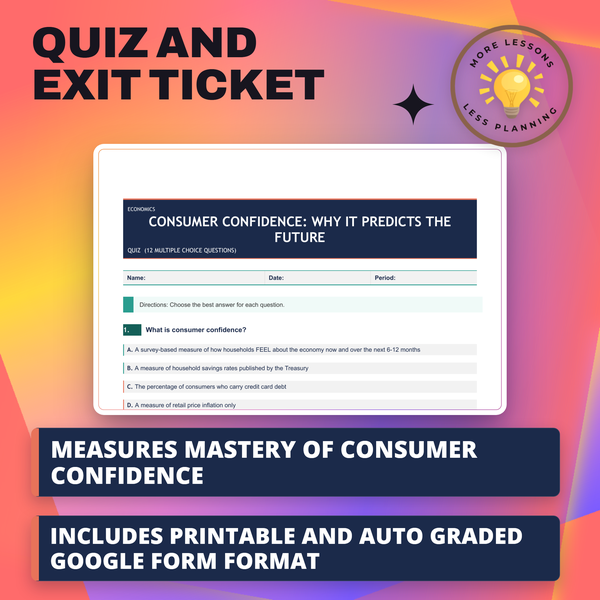
- Quiz + answer key
- Exit ticket + answer key
- Teacher guide
- Teacher presentation notes
What students do
- Distinguish the Conference Board CCI from the University of Michigan ICS and explain why they diverged in 2022
- Read a 2000-2026 line chart to find the Great Recession trough, the pre-pandemic peak, and the 2024 recovery
- Read a scatter plot of confidence against retail sales six months later and evaluate the correlation
- Write a recommendation memo on retail-stock exposure using current confidence and inflation readings
What it covers
- The Conference Board CCI, baseline 1985 equals 100, and the longer-running University of Michigan ICS
- The June 2022 collapse, when the Michigan index hit an all-time low of 50.0 during 9.1% inflation
- Why confidence is a leading indicator that tends to move three to six months before spending does
- The limits of survey-based "soft data," including falling response rates and political polarization
Learning targets
- Define consumer confidence and explain why it predicts spending
- Distinguish the Conference Board and University of Michigan indexes
- Evaluate consumer sentiment as a real-time indicator of where the economy is going
Peek inside
Defining Consumer Confidence
Consumer confidence is a -based measure of how households feel about the economy.
The two main U.S. indexes are the Conference Board CCI and the University of ICS.
Consumer spending is about % of U.S. GDP - so how households feel matters.
Confidence is data (survey-based feelings) - different from hard data.
It is a indicator that often moves BEFORE the hard data does.
1. Q1. A survey-based measure of how households feel about the economy now and where they expect it to go over the next 6-12 months is .
Why this matters
A monthly survey of 600 households helped push the Federal Reserve toward raising interest rates in 2022, which is how this lesson makes a dry indicator feel consequential fast. Students read the University of Michigan index bottoming out at 50.0 that June, its lowest point in 76 years, lower than 2008 or the COVID crash.
Students first treat confidence as a soft, decorative statistic next to something concrete like GDP. Testing the scatter plot of confidence against retail sales six months out, and naming outlier years like 2020's stimulus-fueled spending, convinces them a mood can move money before the money moves.
From one teacher to another
Michigan's consumer sentiment index hit 50.0 in June 2022, the lowest reading in its 76-year history, lower than 2008, lower than the COVID crash, lower than 1980 stagflation, and I use that one number to get students paying attention to a topic that usually reads as dry. They read two real charts, a 2000-2026 line chart of the Conference Board index and a scatter plot testing whether confidence actually predicts retail sales six months out, and I make them name the specific outlier years, like 2020's stimulus-fueled spending and 2019's pre-COVID drop, instead of just eyeballing a trend line. The Fed connection is the part I push hardest: when Michigan's inflation-expectations component spiked to 5.4% in 2022, Powell cited it directly as justification for the rate hikes, and I want students to see that a monthly phone survey of 600 households can move actual policy.
Every file in this toolkit
-
Activity (Student)
Diana's consumer-analyst work sends her into a 2000 to 2026 line chart hunting the Great Recession trough and the 2024 rebound, then a scatter plot testing confidence six months earlier against actual retail sales, before a retail-stock exposure memo.
-
Activity (Answer Key)
A 50.0 reading anchors these answers, tying the Michigan survey's worst month in 76 years to 9.1 percent inflation and showing why the Conference Board held up near 95 thanks to stronger jobs data.
-
Exit Ticket (Student)
The ticket's questions ask which part of the economy the Conference Board index tracks most closely, why sentiment usually predicts retail sales three to six months later, and what made the 2022 confidence collapse unusual. Comparing both indexes' June 2022 readings is the task.
-
Exit Ticket (Answer Key)
Jobs and business conditions mark the Conference Board's focus, pessimism curbing big purchases explains the mechanism behind the lag, and 2022 is flagged as the year confidence and spending diverged instead of falling together. Full marks need all three sub-parts.
-
Guided Notes (Student)
A telephone poll of 600 U.S. households anchors these notes, comparing the Conference Board index against Michigan's own scale, then sending students to the 2000-2026 chart to locate the June 2022 low of 50.0 before testing it against a retail-sales scatter plot.
-
Guided Notes (Teacher Key)
Practice values fill every blank behind the charts, a 2009 low near 25, a 2018 peak near 138, and January 2022's reading of 128 even as the Michigan index had already slid to 67.2, plus why the Fed watches the inflation-expectations component so closely.
-
Quiz (Student)
Twelve items separate the Conference Board index from Michigan's household survey, name the index's baseline year, and ask why the Federal Reserve tracks its inflation expectations component every month.
-
Quiz (Answer Key)
1985 serves as the Conference Board's baseline year, the Michigan survey falls to a reading of 50.0 in June 2022, and the two surveys diverge that year over jobs versus household prices.
-
Slides
Michigan's sentiment survey craters to 50.0 in June 2022, a reading below both the 2008 crash and 1980 stagflation, right before a scatter plot checks whether that confidence number six months earlier lines up with the retail sales that follow it.
-
Teacher Guide
Discussion prompts test whether a mood indicator failed when Michigan's index hit its all time low in 2022 without a matching drop in retail sales. One extension has pairs redesign the survey itself using the limits named on slide 14.
-
Teacher Presentation Notes
Economist John Maynard Keynes and his 1936 phrase animal spirits get their own slide, followed by a prompt asking whether feeling better could lift the economy on its own. Extension notes tie a mid-2007 dip in the index to the recession that followed six months later.
Download
Where should I send the next one?
Everything here is free and it stays that way. Leave your email and I'll send you the new lessons as they go up. You can unsubscribe from any one of them.
Related resources
Real vs Nominal GDP: Why It Matters
Recession Compared 2008 vs 2020 vs 2024
The Business Cycle Boom, Bust, Recovery
Unemployment Rate: How It's Calculated
Amazon Warehouses: Working Conditions Investigation
Anti-Trust Laws and Regulation: Promoting Fair Competition
Every lesson on this site is free to download and use. If one of them saved you a prep period, you can chip in a few bucks toward my three kids' daycare fund. That's genuinely where tips go.