Recession Compared 2008 vs 2020 vs 2024
Quality reviewed September 2026
- Grades
- Grades 9-12
- Time
- About two 50-minute class periods
- Includes
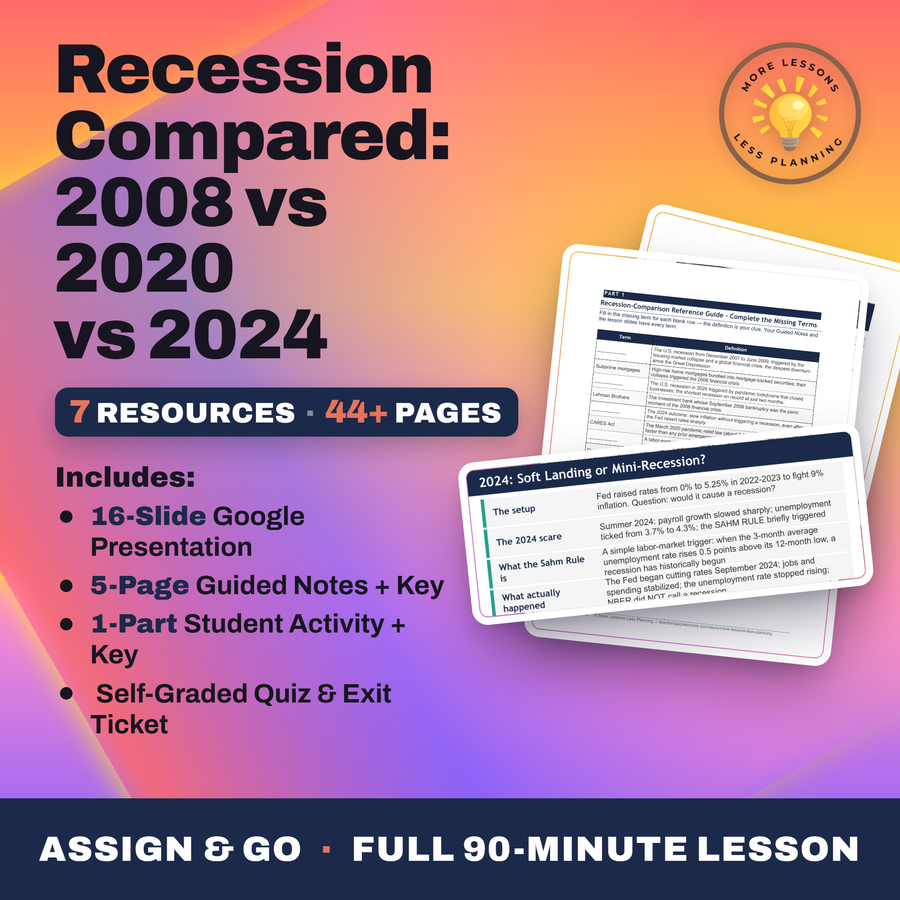
- 11 ready-to-teach files
- Format
- Word (.docx) · PowerPoint (.pptx)
- Slide deck
- Guided notes
- Guided notes teacher key
- Activity + answer key
- Quiz + answer key
- Exit ticket + answer key
- Teacher guide
- Teacher presentation notes
What students do
- Compare the 2008 housing collapse, 2020 pandemic shutdown, and 2024 soft-landing scare on cause, depth, and recovery
- Read three overlay charts to rank GDP drops, unemployment peaks, and stock market crashes across all three downturns
- Explain why the 2020 recovery was faster than 2008's even though 2020's GDP drop was deeper
- Recommend a policy response for a hypothetical 2027 bank-failure scenario, modeled on the closest historical case
What it covers
- The 2008 Great Recession's 10.0% unemployment peak against 2020's 14.7% peak, the highest since the Great Depression
- Why an intact financial system and a faster, larger $4T fiscal response made 2020's recovery V-shaped instead of L-shaped
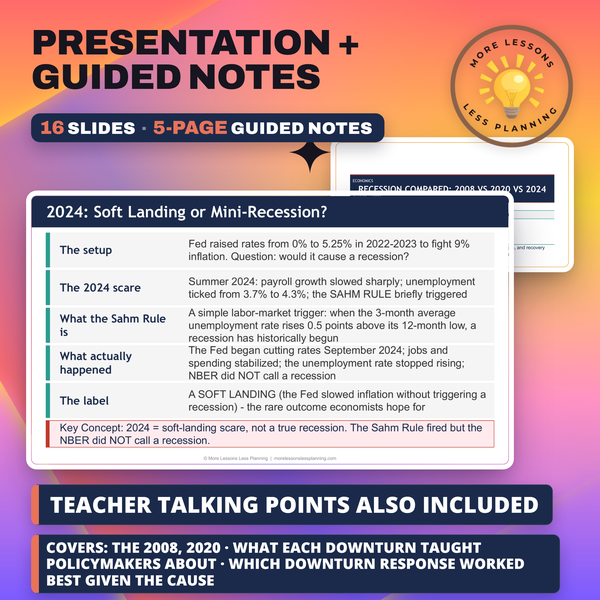
- The Sahm Rule triggering in July 2024 without the NBER ever calling a recession
- TARP and ARRA in 2008 against the CARES Act and American Rescue Plan in 2020, and what each was built to fix
Learning targets
- Compare the 2008, 2020, and 2024 economic downturns on causes, depth, and recovery
- Identify what each downturn taught policymakers about the next response
- Evaluate which downturn response worked best given the cause
Peek inside
The Cause
Housing bubble: U.S. home prices rose 60% from 2000-2006
Subprime mortgages: high-risk loans bundled into mortgage-backed securities
When prices fell, banks holding MBS were insolvent
Lehman Brothers bankruptcy (Sept 2008) was the panic moment
The Cause and the Recovery
U.S. home prices rose % from 2000-2006 (a clear bubble).
Banks made millions of mortgages - high-risk loans bundled into mortgage-backed securities.
The panic moment was the September 2008 bankruptcy of Brothers.
Real GDP fell about % from peak during the 2008 Great Recession.
Unemployment peaked at % in October 2009.
1. The deepest U.S. downturn since the Great Depression - lasting from December 2007 to June 2009 and set off by a housing-market collapse and a global financial crisis - is the .
Why this matters
Every recession gets described the same way in headlines, but a 14.7% unemployment peak in 2020 and a 10.0% peak in 2008 are not the same event in different years. Students line up three downturns on overlay charts of GDP, unemployment, and the S&P 500 to rank which one did the most damage and recovered the fastest.
What throws students is that 2020 crashed GDP harder than 2008 and still bounced back faster, because the banks were never actually broken. A hypothetical 2027 bank-failure scenario at the end forces them to reason from mechanism instead of picking whichever year sounds scariest.
From one teacher to another
Every one of my students assumes a recession looks the same every time, so I put three real downturns side by side and make them rank the damage themselves. They read three overlay charts, real GDP, unemployment, and the S&P 500, each indexed to the same starting point, and discover that 2020 crashed GDP harder than 2008 (9% versus 4%) but bounced back faster because the banks were never actually broken. The 2024 case is the one most of them have never studied closely: the Fed's rate hikes briefly tripped the Sahm Rule that summer, and the class has to work out why that didn't turn into a real recession before I hand them a 2027 bank-failure scenario and make them pick which historical playbook actually fits.
Every file in this toolkit
-
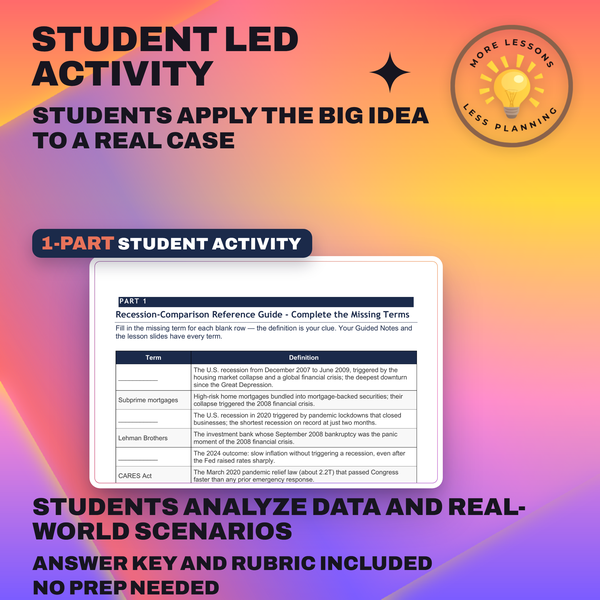
Activity (Student)
Devon Brooks has students line up 2008, 2020, and 2024 on matching charts and rank which crash cut deepest and which one bounced back the fastest, explaining why 2020 fell harder than 2008 yet recovered sooner.
-
Activity (Answer Key)
Peak by peak, the key credits an intact banking system and a larger, faster fiscal response for why the 14.7 percent 2020 unemployment spike faded quicker than the 10.0 percent 2008 peak or the 4.3 percent 2024 blip.
-
Exit Ticket (Student)
Items identify which downturn had the sharpest V-shaped recovery, which one traces to a financial or banking crisis, and what followed once the Sahm Rule briefly triggered in 2024 without a recession call. Students stack 2008 against 2020 by trigger, severity, and how fast each snapped back.
-
Exit Ticket (Answer Key)
The 2020 COVID recession had the sharpest V-shaped bounce, 2008 traces to a banking crisis, and a preemptive rate cut that September plus a soft landing is what followed the Sahm Rule trigger. This one earns a teacher's read instead of a point scale.
-
Guided Notes (Student)
Three downturns line up on one chart, a 4 percent GDP drop in 2008 against a 9 percent drop in 2020, then unemployment peaks get ranked, 10.0 percent in October 2009 versus 14.7 percent in April 2020, before the Sahm Rule fires briefly in July 2024.
-
Guided Notes (Teacher Key)
Each policy response gets totaled, about $1.5 trillion in 2008 between two relief bills against roughly $4 trillion in 2020 between two more, then the notes explain why banks that were never actually broken let the second recovery outrun the first despite a deeper GDP drop.
-
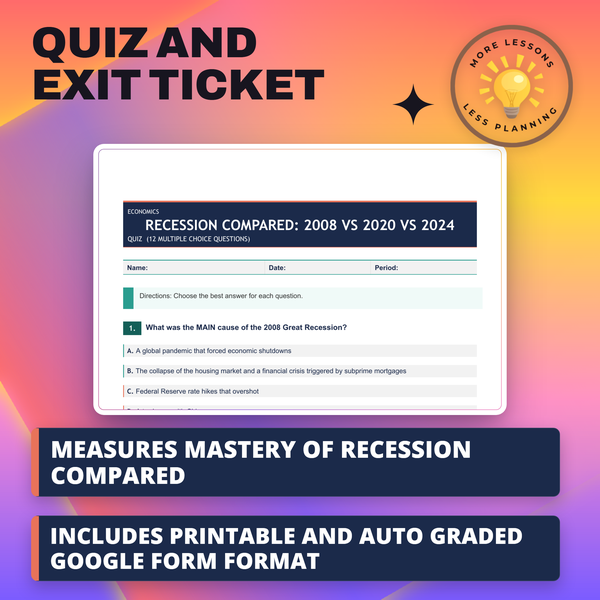
Quiz (Student)
Cause is the ranking test for downturns in 2008, 2020, and 2024, as items name the Sahm Rule's trigger and ask why a deeper GDP drop in 2020 still produced the faster recovery of the three.
-
Quiz (Answer Key)
2020's unemployment peak of 14.7 percent beats 2008's 10.0 percent, intact banks plus a bigger, quicker relief package get the credit for the faster rebound, and the Sahm Rule trips in 2024 without an actual recession.
-
Slides
Three overlay charts anchor the comparison, unemployment, the S&P 500, and GDP, all lined up against their own pre-recession peaks. A 14.7 percent unemployment high in 2020 topped 2008's 10.0 percent, yet the recovery moved faster once the Sahm Rule and the soft landing debate get their own slide.
-
Teacher Guide
Stock prices, output, and joblessness on three indexed charts structure the pacing guide, and discussion prompts ask whether the Sahm Rule still means what it used to after firing without a recession call in 2024.
-
Teacher Presentation Notes
A frozen banking system gets blamed for 2008's slow crawl back on one card, while an intact one explains why 2020's deeper GDP drop still bounced back faster on the very next card.
Download
Where should I send the next one?
Everything here is free and it stays that way. Leave your email and I'll send you the new lessons as they go up. You can unsubscribe from any one of them.
Related resources
Consumer Confidence Why It Predicts the Future
Real vs Nominal GDP: Why It Matters
The Business Cycle Boom, Bust, Recovery
Unemployment Rate: How It's Calculated
Amazon Warehouses: Working Conditions Investigation

Anti-Trust Laws and Regulation: Promoting Fair Competition
Every lesson on this site is free to download and use. If one of them saved you a prep period, you can chip in a few bucks toward my three kids' daycare fund. That's genuinely where tips go.