The Business Cycle Boom, Bust, Recovery
Slides
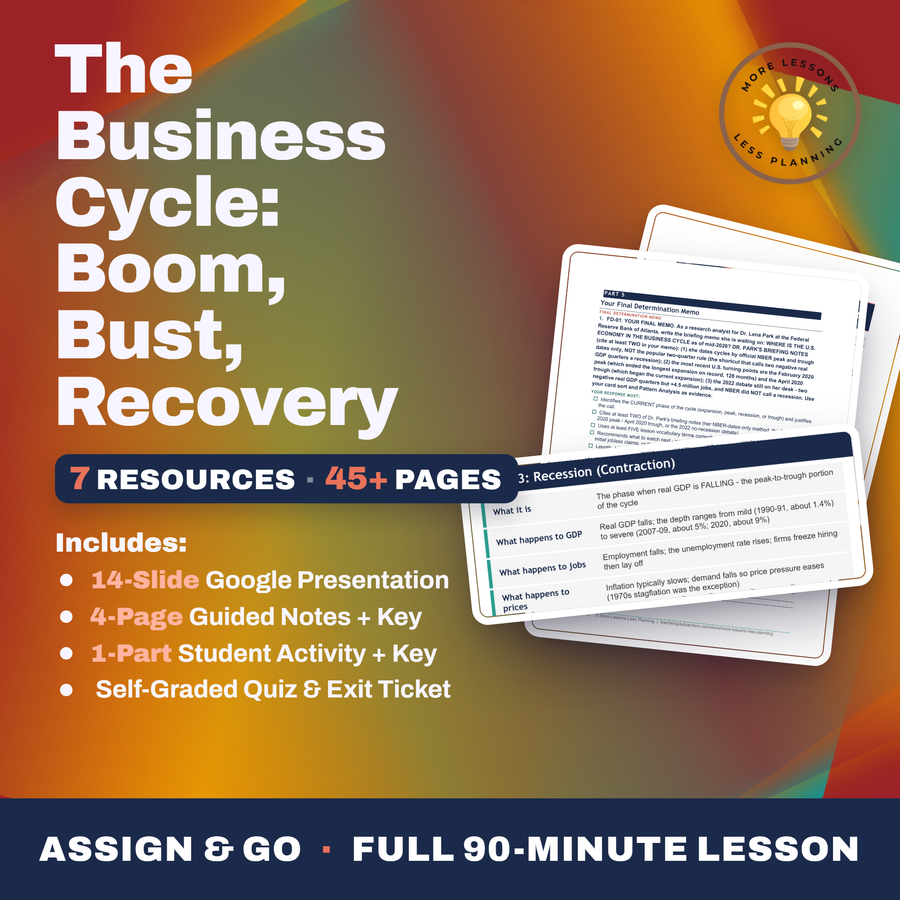
NBER's dated turning points put the expansion's finish line in February 2020 after 128 months, right next to the two-month contraction that followed, then a chart works out why average expansions run 64 months against an average recession of just 10 to 11.
Download the Slides
PowerPoint (.pptx)
Where should I send the next one?
Everything here is free and it stays that way. Leave your email and I'll send you the new lessons as they go up. You can unsubscribe from any one of them.
Did this save you a prep period? You can chip in toward my three kids' daycare fund. Everything on this site stays free either way.