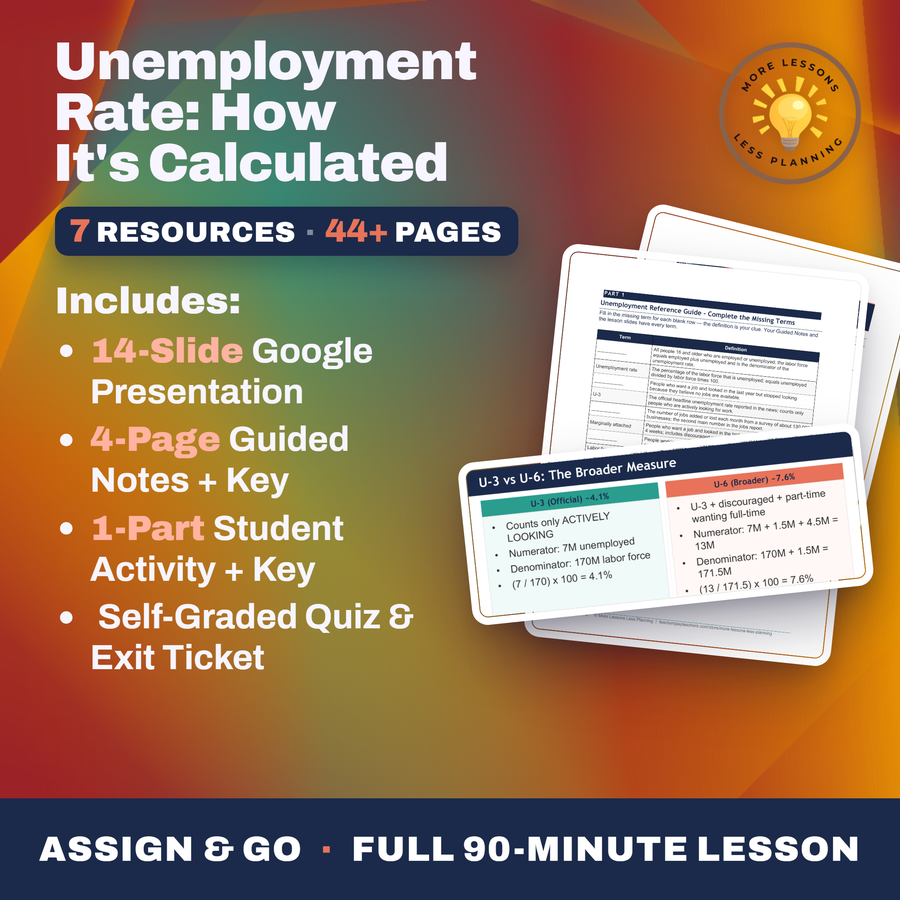
Unemployment Rate: How It's Calculated
Quality reviewed September 2026
- Grades
- Grades 9-12
- Time
- About two 50-minute class periods
- Includes
- 10 ready-to-teach files
- Format
- Word (.docx) · PowerPoint (.pptx)
- Slide deck
- Guided notes
- Guided notes teacher key
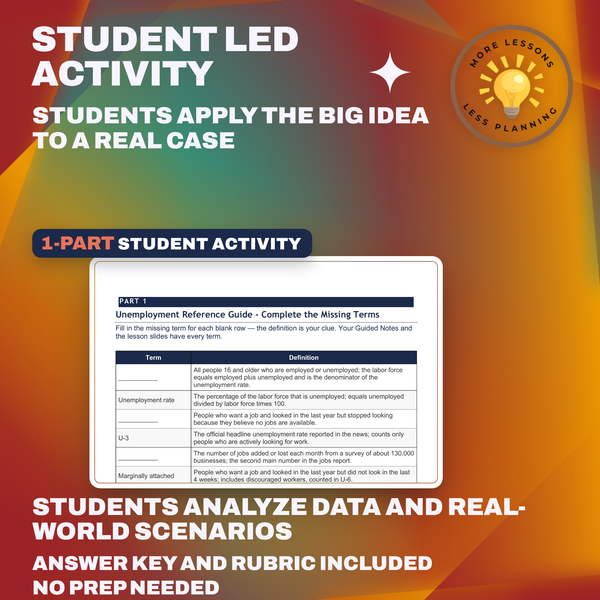
- Activity + answer key
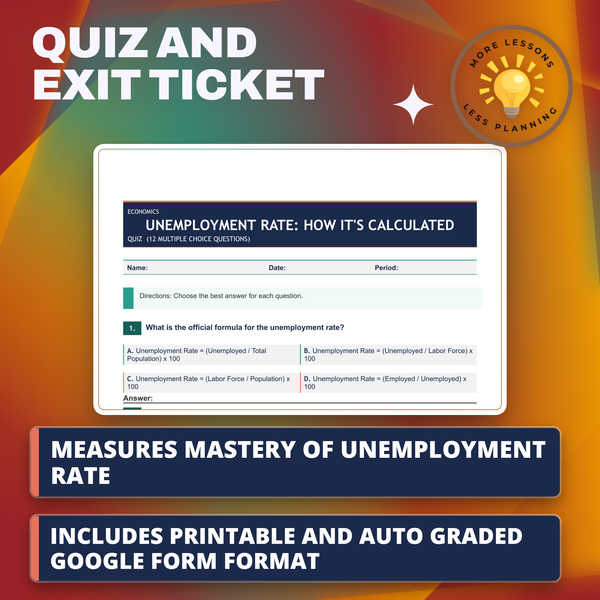
- Quiz + answer key
- Exit ticket + answer key
- Teacher guide
What students do
- Calculate U-3 from labor force data, showing the (Unemployed / Labor Force) x 100 formula step by step
- Compute U-6 across three scenarios - a normal year, the 2009 recession, and a recovery year - and compare the gaps
- Read a U-3 vs U-6 line chart and a monthly jobs bar chart to pull specific values, including the April 2020 crash
- Write a memo to the BLS Commissioner evaluating a politician's "historically low unemployment" claim using real data
What it covers
- The three conditions the BLS actually requires to count someone as unemployed, and who gets left out entirely
- The unemployment rate formula, with the labor force - not total population - as the denominator
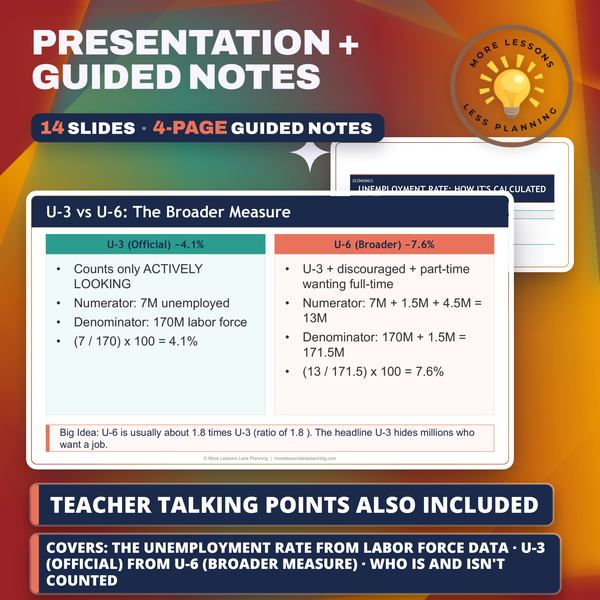
- Why U-3, the headline rate, sits below U-6, the broader measure that adds discouraged and involuntary part-time workers
- How discouraged workers leaving the labor force can make U-3 fall even when nobody found a new job
Learning targets
- Calculate the unemployment rate from labor force data
- Distinguish U-3 (official) from U-6 (broader measure)
- Identify who is and isn't counted in the official unemployment rate
Peek inside
Unemployed means ALL THREE:
Without a job in the reference week
AVAILABLE to start work right now
ACTIVELY looked in the last 4 weeks
NOT Unemployed (just no job)
The Three Conditions for Being UNEMPLOYED
To be officially unemployed, a person must be a job in the reference week.
They must also be to start work right now.
AND they must have looked for work in the last 4 weeks.
Retirees, students, and stay-at-home parents are NOT unemployed - they are not in the labor .
People who gave up looking are NOT counted as unemployed because they did not in the last 4 weeks.
1. All people 16 and older who are either working or actively job-hunting - employed plus jobless searchers - together make up the .
Why this matters
The unemployment rate on the news leaves people out on purpose, and most students never learn the denominator is the labor force, not the total population. Get that wrong and a real 4.1% becomes a wrong 2.6%, the exact mistake this lesson corrects before students calculate U-3 and U-6 across three scenarios.
I watch the same realization hit every class: someone who stops looking for work can make the headline rate fall even though nobody found a job. Reading the real April 2020 numbers, U-3 at 14.7% next to U-6 at 22.8%, off an actual chart is what makes the gap concrete enough to use against a politician's claim.
From one teacher to another
I built this around the single fact that trips up almost every student the first time: the unemployment rate they hear on the news leaves people out on purpose. Students drill the formula, unemployed divided by labor force times 100, and the number one thing I correct is using total population as the denominator instead of the labor force, since that mistake alone turns a real 4.1% into a wrong 2.6%. From there they compute both U-3 and U-6 across three BLS-style scenarios, a normal year, the 2009 recession, and a recovery year, showing every step so the gap between the headline rate and the broader measure becomes something they calculated themselves instead of just read. The chart work backs it up with real data too, students read the actual U-3 versus U-6 line from 2000 to 2026 and pull the April 2020 numbers, U-3 at 14.7% next to U-6 at 22.8%, off the chart themselves. Everything builds toward a memo they write to the BLS Commissioner, evaluating a politician's claim of "historically low unemployment," where they have to name what data is missing and cite one number they actually read off a chart rather than take the headline at face value.
Every file in this toolkit
-
Activity (Student)
Morgan Ellis runs the BLS formula against three built scenarios, a calm labor market, the 2009 downturn, and a rebound year, so students compute U-3 and U-6 by hand before reading the April 2020 numbers off the real unemployment chart.
-
Activity (Answer Key)
Math turns 158 million employed and 6 million unemployed into a 3.7 percent U-3, widens it to a 16.9 percent U-6 for the 2009 scenario, and checks the April 2020 chart reading of 14.7 percent against 22.8 percent.
-
Exit Ticket (Student)
Questions identify which scenario counts as unemployed under the official U-3 rule, work out the rate from 8 million jobless against a 160 million labor force, and explain why U-6 sits higher than U-3. Students explain how U-3 can drop even without a single new hire.
-
Exit Ticket (Answer Key)
Someone jobless who applied to eight positions in four weeks is the counted case, 5.0 percent is the worked-out rate, and adding discouraged and part-time-by-necessity workers on top is why U-6 sits higher. This one gets a plain teacher read, no point rubric attached.
-
Guided Notes (Student)
The formula gets worked by hand, unemployed over the labor force multiplied by 100, landing on a 2026 U-3 of 4.1 percent, then U-6 gets computed at 7.6 percent by adding discouraged and underemployed workers before April 2020's real spike gets pulled straight off a two-line chart.
-
Guided Notes (Teacher Key)
Both formulas get completed step by step, seven million unemployed over a 170 million labor force for 4.1 percent, then 13 over 171.5 million for 7.6 percent U-6, pulling April 2020's real spike, 14.7 percent against 22.8 percent, straight off the chart.
-
Quiz (Student)
Seven million unemployed against 170 million in the labor force sets up the U-3 formula, while other items sort a retiree and a discouraged worker and compare that rate to U-6.
-
Quiz (Answer Key)
Seven million over 170 million works out to a 4.1 percent U-3 rate, marginally attached and involuntary part-time workers push U-6 up to 7.6 percent, and a retiree counts as not in the labor force.
-
Slides
The unemployment math turns 7 million jobless over a 170 million labor force into 4.1 percent using 2026 figures, before a line chart pulls the April 2020 crash, U-3 at 14.7 percent against U-6 at 22.8.
-
Teacher Guide
A family audit has students interview three to five relatives and sort each into employed, unemployed, or not in the labor force using the three BLS tests, then compare the household rate to 4.1 percent. One question classifies an engineer who stopped applying after six months.
Download
Where should I send the next one?
Everything here is free and it stays that way. Leave your email and I'll send you the new lessons as they go up. You can unsubscribe from any one of them.
Related resources

Consumer Confidence Why It Predicts the Future
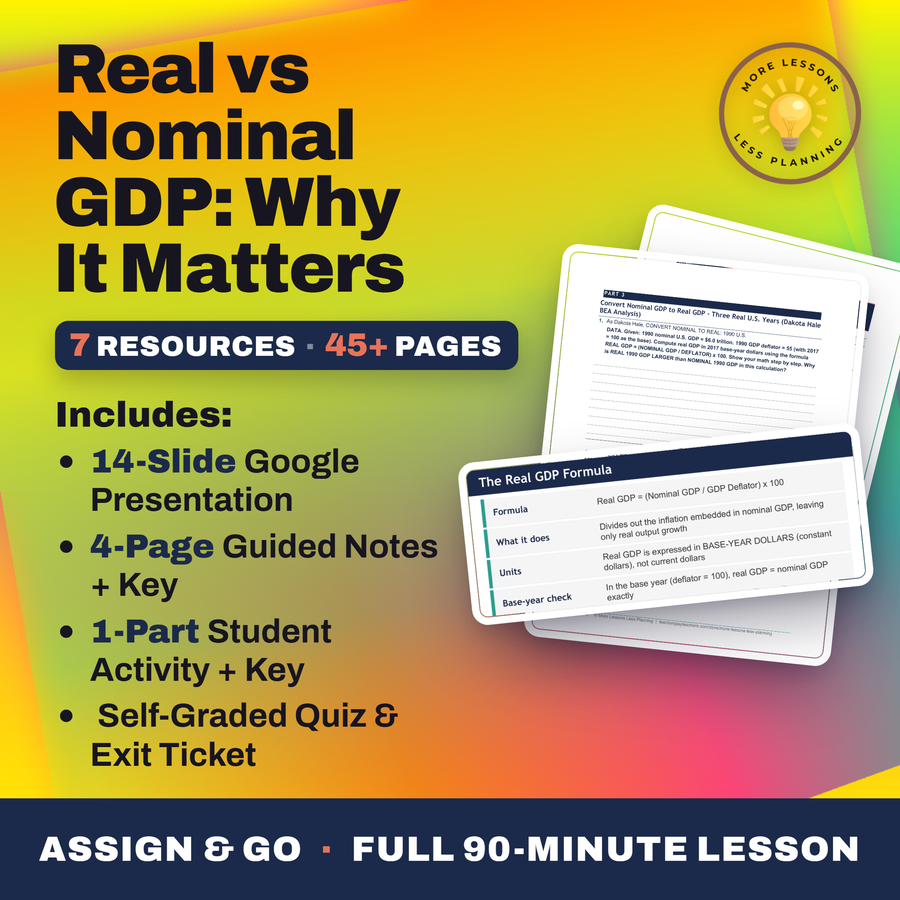
Real vs Nominal GDP: Why It Matters
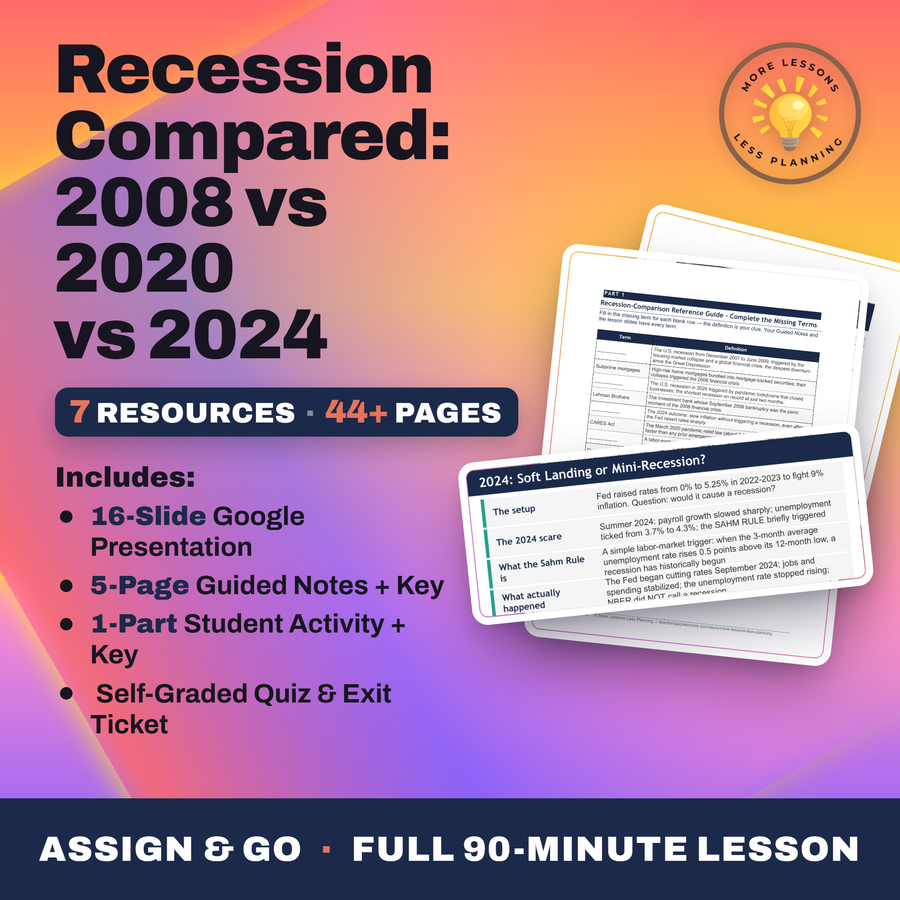
Recession Compared 2008 vs 2020 vs 2024
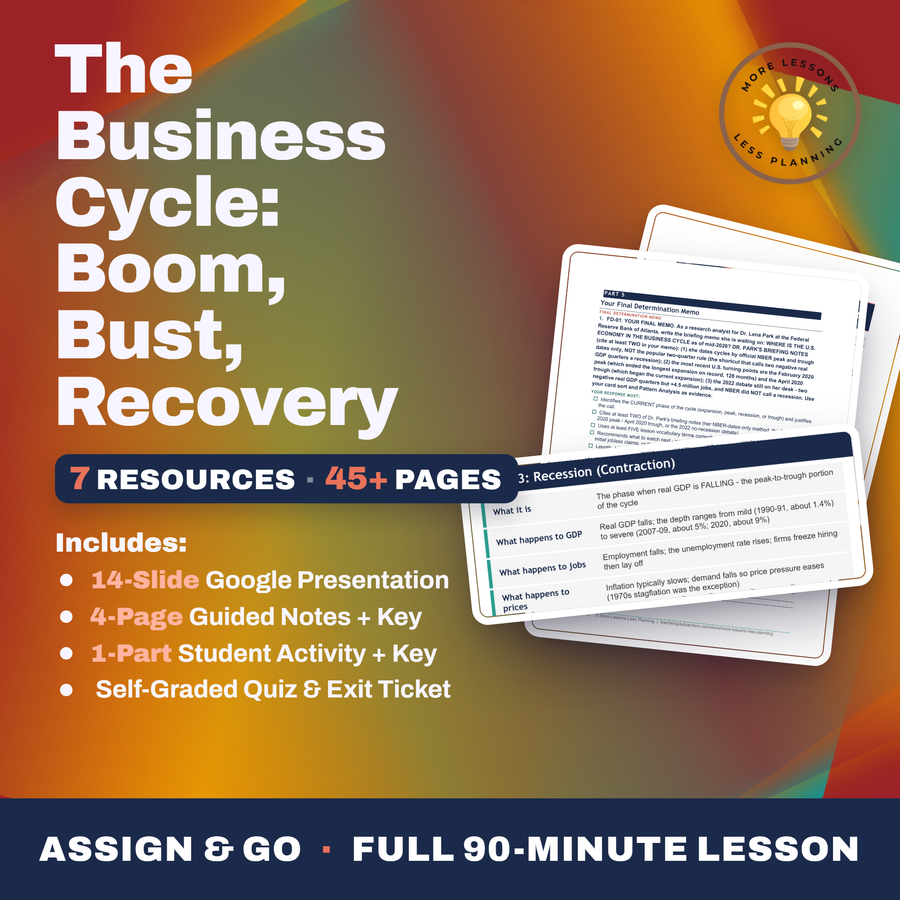
The Business Cycle Boom, Bust, Recovery
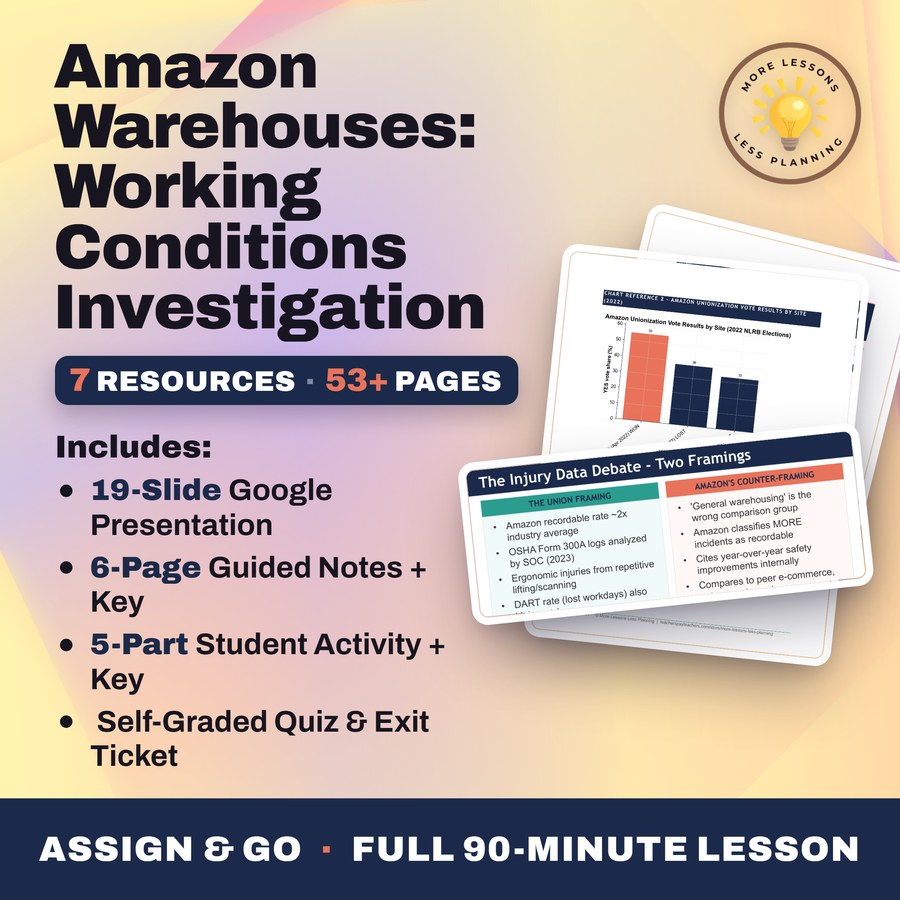
Amazon Warehouses: Working Conditions Investigation

Anti-Trust Laws and Regulation: Promoting Fair Competition
Every lesson on this site is free to download and use. If one of them saved you a prep period, you can chip in a few bucks toward my three kids' daycare fund. That's genuinely where tips go.