
Wealth Inequality: The Top 1% Explained
Quality reviewed September 2026
- Grades
- Grades 9-12
- Time
- About two 50-minute class periods
- Includes
- 10 ready-to-teach files
- Format
- Word (.docx) · PowerPoint (.pptx)
- Slide deck
- Guided notes
- Guided notes teacher key
- Activity + answer key
- Quiz + answer key
- Exit ticket + answer key
- Teacher guide
What students do
- Distinguish wealth as a stock from income as a flow, and explain why wealth is more concentrated at the top
- Read a U.S. wealth Lorenz curve to find the bottom 50% share, then calculate what the top 10% must hold
- Compare wealth Gini coefficients across countries and calculate the racial wealth gap ratio from real median figures
- Write a policy memo to a senator recommending one wealth-inequality fix, citing two specific lesson numbers
What it covers
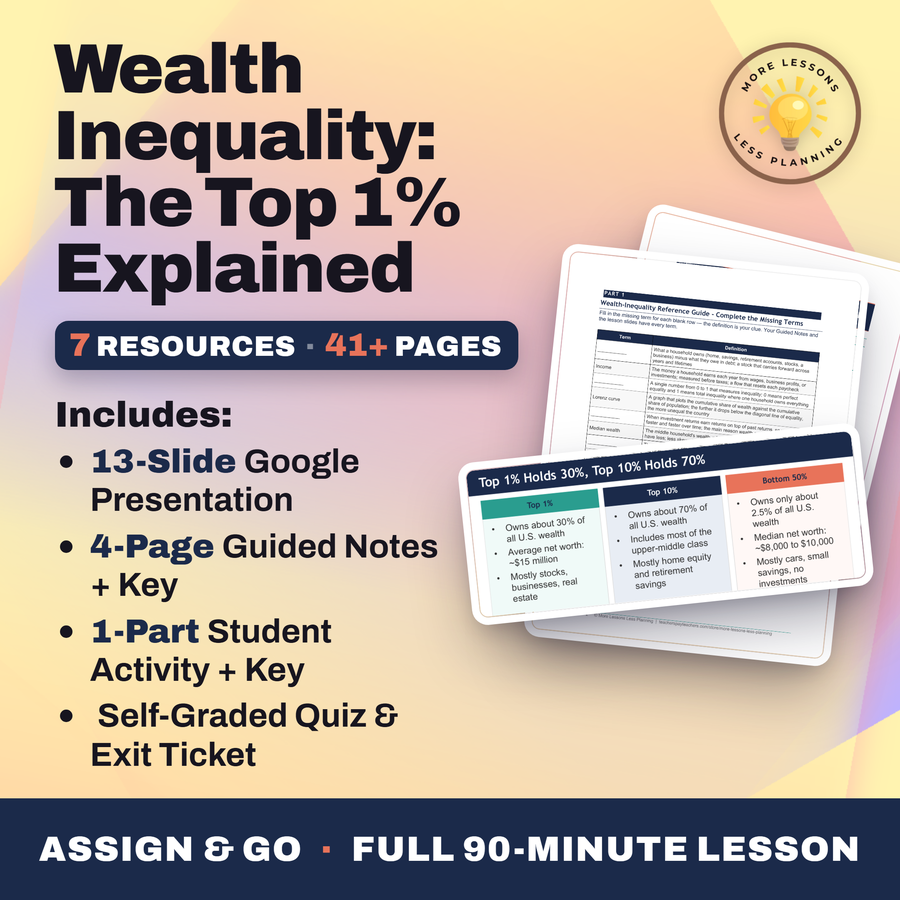
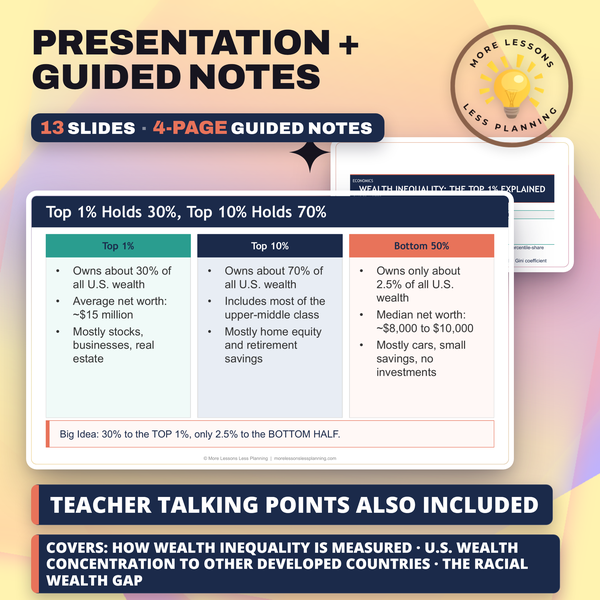
- The headline U.S. numbers - the top 1% holding about 30% of wealth, the bottom 50% holding only about 2.5%
- The Gini coefficient and Lorenz curve as the standard tools for measuring inequality, with the U.S. at about 0.85
- The racial wealth gap, where median white household wealth runs about six times median Black household wealth
- How compounding turns a starting-balance advantage into a permanently larger ending balance over decades
Learning targets
- Identify how wealth inequality is measured using the Gini coefficient and percentile-share statistics
- Compare U.S. wealth concentration to other developed countries using the Gini coefficient
- Evaluate the racial wealth gap and the historical drivers that produced it
Peek inside
Income
What you EARN each year (wages, profits)
Top 1% of earners take about 20% of income
Reset every paycheck
Less unequal than wealth
Two Different Things, Two Different Numbers
is what you EARN each year (wages, profits).
The top 1% of earners take about % of income.
is what you OWN minus what you owe.
The top 1% holds about % of all wealth.
Wealth is a STOCK; income is a .
1. What a household OWNS (home, savings, retirement accounts, stocks, a business) minus what they owe in debt - a stock that carries forward across years and lifetimes - is a household's .
Why this matters
Wealth and income get used interchangeably by nearly every student, so separating them comes first: income resets every paycheck, wealth compounds and gets inherited. A real U.S. Lorenz curve puts a number on it, the bottom 50% holding only about 2.5% against the top 1%'s roughly 30%.
The compounding math lands hardest: a $100,000 balance and a $10,000 balance at the same 7% return stay exactly 10 times apart forever. Once students calculate the racial wealth gap ratio themselves, redlining stops sounding like an assertion and starts feeling proven.
From one teacher to another
Most students conflate wealth and income, so I spend the first stretch making them separate the two for good: income resets every paycheck, wealth is a stock that compounds and gets inherited. From there they read a real U.S. wealth Lorenz curve themselves, pulling the bottom 50%'s share directly off the chart and then calculating what the top 10% must hold since the shares have to add to 100%. The Gini coefficient work follows the same rule, students find the U.S. at about 0.85 against France's 0.70 and Japan's 0.63 and have to say in plain English what a bigger gap actually means for how evenly wealth is spread. The racial wealth gap gets the same rigor rather than a vague statement: they read real median figures for white, Black, and Hispanic households, calculate the dollar gap and the ratio themselves, and connect it back to redlining as a structural cause rather than an individual failing. The compounding math closes the loop, showing that a $100,000 starting balance and a $10,000 starting balance at the same 7% return end up exactly 10 times apart, which is the number that makes inheritance matter so much. Their final policy memo has to name one fix and back it with real numbers, not just a preference.
Every file in this toolkit
-
Activity (Student)
The bottom half of U.S. households gets pinned to its exact wealth share on a real Lorenz curve, then students work out the top 10 percent's share, the white to Black wealth ratio, and a compounding gap between two starting balances.
-
Activity (Answer Key)
Answer key math puts the bottom 50 percent at a 2.5 percent wealth share against the top 10 percent's 70 percent, then works out the $240,100 gap between median white and Black household wealth and a 6.3 to 1 ratio.
-
Exit Ticket (Student)
Short questions rate what a Gini score of 0.85 says about wealth spread, name roughly what share of all wealth the top 1 percent of U.S. households holds, and identify the best explanation for the racial wealth gap. One inequality policy needs naming, defended with a lesson number.
-
Exit Ticket (Answer Key)
Highly unequal is the read on a 0.85 Gini score, about 30 percent is the top 1 percent's wealth share, and inherited wealth locked out by practices like redlining explains the racial gap. A short written answer closes this one, graded without a fixed scale.
-
Guided Notes (Student)
Wealth, what a household owns, gets separated from income, which resets each paycheck, then a Lorenz curve for the U.S. shows the bottom 50 percent holding 2.5 percent against the top 1 percent's 30 percent, before Gini scores of 0.85 here get compared against 0.63 in Japan.
-
Guided Notes (Teacher Key)
The compounding math runs both ways in these answers, $10,000 growing to about $150,000 and $100,000 growing to about $1,500,000 at 7 percent over 40 years, then the racial gap gets reported, a median white household near $285,000 against a median Black household near $44,900.
-
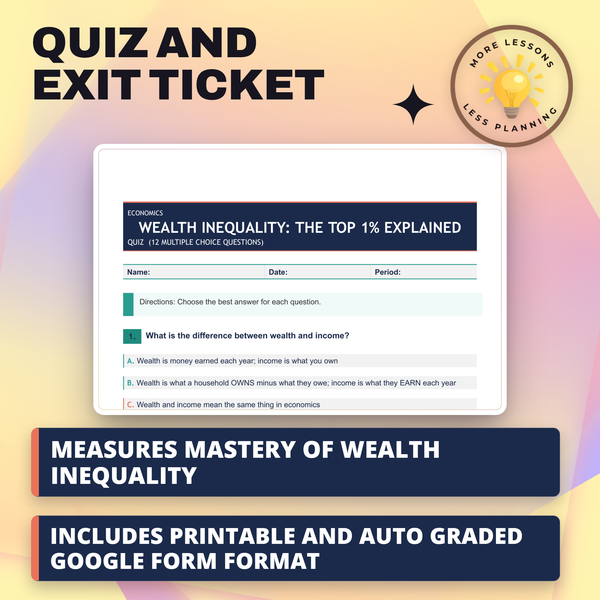
Quiz (Student)
A Lorenz curve and a Gini scale from zero to one anchor items comparing wealth to income, naming what redlining did, and asking how a starting balance compounds over time.
-
Quiz (Answer Key)
The top 1 percent holds about 30 percent of U.S. wealth against the bottom half's 2.5 percent, the Gini runs near 0.85, and redlining stands as the practice behind the racial wealth gap.
-
Slides
A Lorenz curve carries the bottom half's 2.5% share against the top 1 percent's 30% on one slide, a compounding chart runs $10,000 against $100,000 at 7% over 40 years, then a racial-gap slide sets $285,000 white wealth against $44,900 Black and $61,600 Hispanic.
-
Teacher Guide
Two made-up households anchor a compounding extension, one starting at $0 and the other with a $50,000 inheritance, both saving $5,000 a year at 7 percent for 40 years before students total the gap.
Download
Where should I send the next one?
Everything here is free and it stays that way. Leave your email and I'll send you the new lessons as they go up. You can unsubscribe from any one of them.
Related resources

Pandemic Economics: COVID's Lasting Impact

The Billionaire Tax Debate
Universal Basic Income: Free Money for Everyone?

Why Gen Z Can't Buy a House

Amazon Warehouses: Working Conditions Investigation

Anti-Trust Laws and Regulation: Promoting Fair Competition
Every lesson on this site is free to download and use. If one of them saved you a prep period, you can chip in a few bucks toward my three kids' daycare fund. That's genuinely where tips go.