Wealth Inequality: The Top 1% Explained
Slides
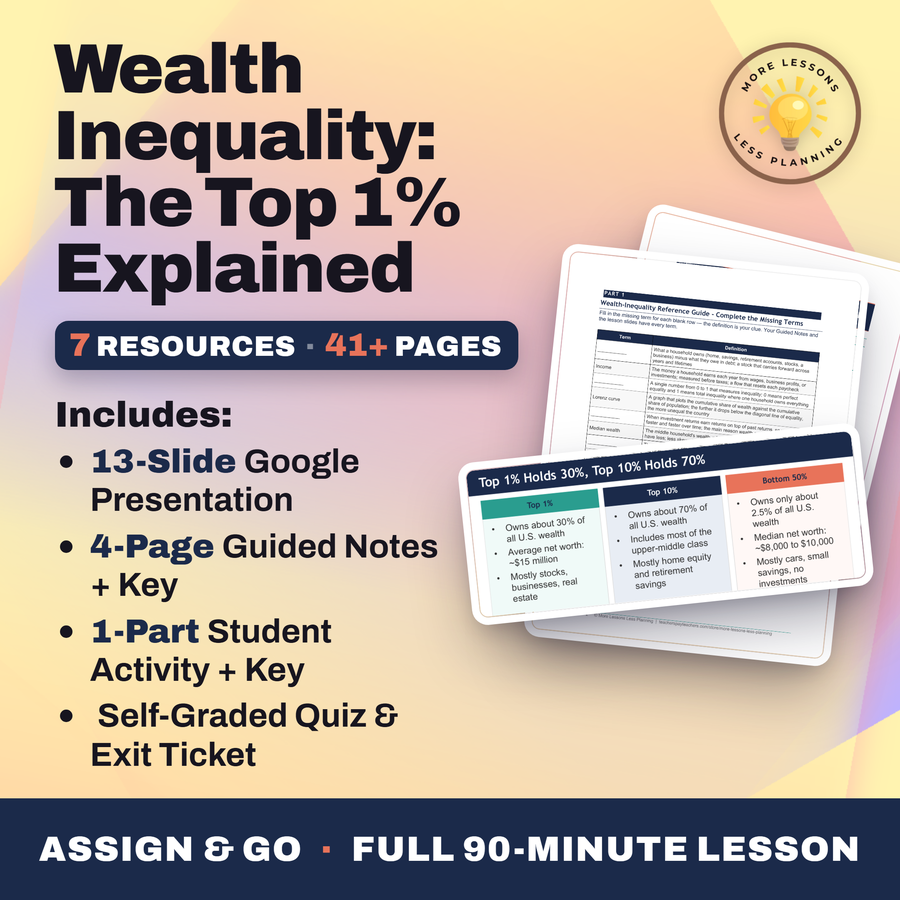
A Lorenz curve carries the bottom half's 2.5% share against the top 1 percent's 30% on one slide, a compounding chart runs $10,000 against $100,000 at 7% over 40 years, then a racial-gap slide sets $285,000 white wealth against $44,900 Black and $61,600 Hispanic.
Download the Slides
PowerPoint (.pptx)
Where should I send the next one?
Everything here is free and it stays that way. Leave your email and I'll send you the new lessons as they go up. You can unsubscribe from any one of them.
Did this save you a prep period? You can chip in toward my three kids' daycare fund. Everything on this site stays free either way.