Pandemic Economics: COVID's Lasting Impact
- Slide deck
- Guided notes
- Guided notes teacher key
- Activity + answer key
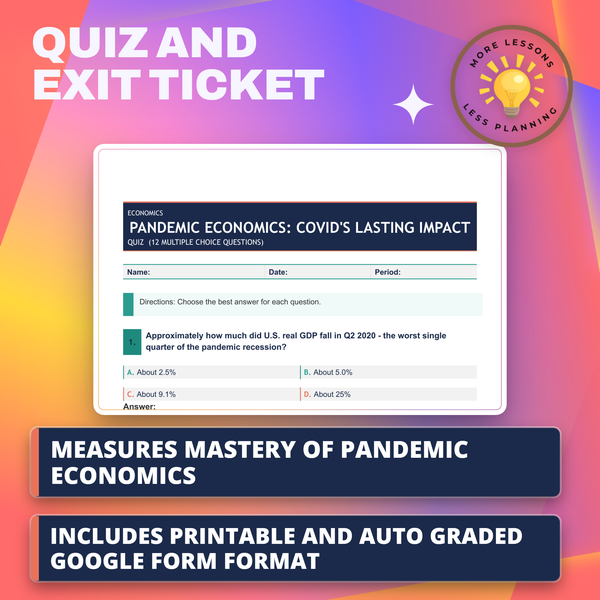
- Quiz + answer key
- Exit ticket + answer key
- Teacher guide
Where should I send the next one?
Everything here is free and it stays that way. Leave your email and I'll send you the new lessons as they go up. You can unsubscribe from any one of them.
Every file in this toolkit
Related resources
Why Gen Z Can't Buy a House
Big Tech Antitrust - Google Apple Amazon Meta
Credit Scores: The Number That Runs Your Life
Economic Systems - Capitalism vs Socialism vs Mixed
Externalities When Markets Hurt Others
Factors of Production - Land, Labor, Capital, and Entrepreneurship
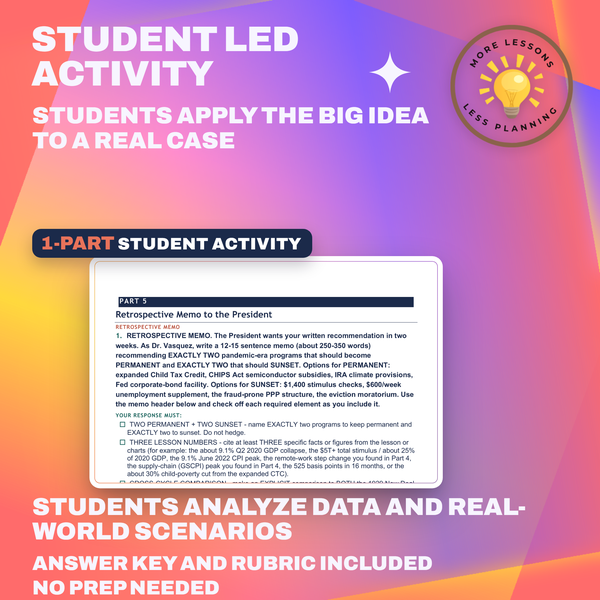
What students do
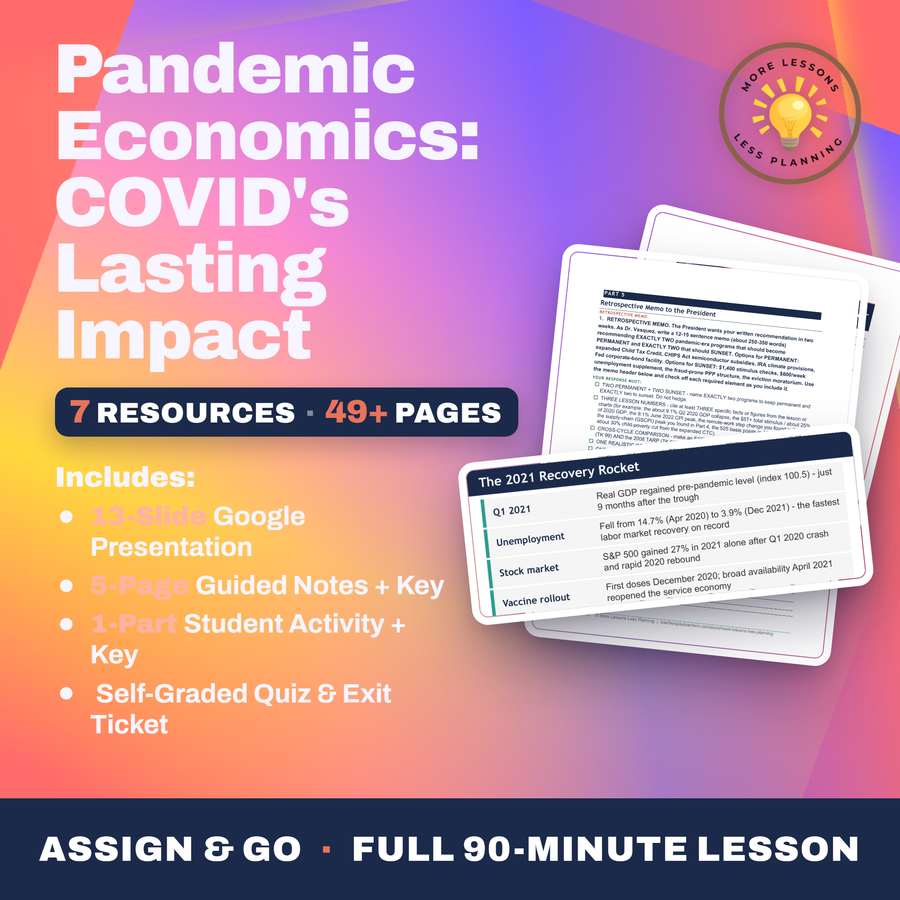
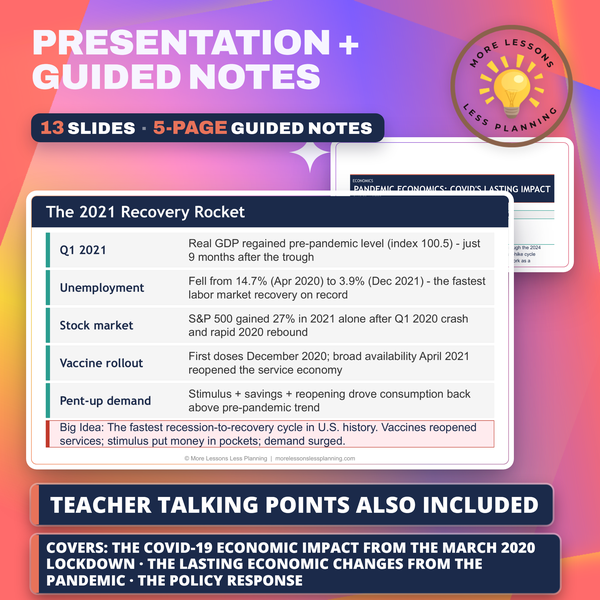
- Trace U.S. real GDP from the 9.1% Q2 2020 collapse through the 2021 recovery on the indexed GDP chart
- Compare the CARES Act, the American Rescue Plan, and the Fed's zero-rate policy to the 1929 and 2008 policy playbooks
- Identify which pandemic-era change, remote work, supply-chain reshoring, or the inflation surge, became permanent
- Calculate how the roughly $5 trillion in combined pandemic stimulus compares to prior recession responses
What it covers
- The sharpest single-quarter GDP contraction on record and the shortest recession in NBER history
- The $2.2 trillion CARES Act and the $1.9 trillion American Rescue Plan
- Why the Fed held rates near zero from March 2020 to March 2022, and what that fed into by 2022
- Which pandemic-era shifts outlasted the pandemic itself
Learning targets
- Trace the COVID-19 economic impact from the March 2020 lockdown through the 2024 recovery: GDP collapse, stimulus, V-shape rebound, inflation surge, and rate-hike cycle
- Identify the lasting economic changes from the pandemic: remote/hybrid work as a permanent shift, supply-chain reshoring, and the 2021-2024 inflation surge
- Evaluate the policy response across the cycle (CARES Act, ARP, Fed zero-rate + QE, then 2022-2023 rate hikes) and compare it to the 1929 and 2008 playbooks
From one teacher to another
My students only remember 2020-2024 in fragments: the March 2020 shutdown, the stimulus checks, then somehow prices went up, and I wanted a lesson that ties those fragments into an actual timeline. I run the GDP and unemployment charts alongside the 1929 and 2008 responses so students judge whether the pandemic response worked instead of just reciting what happened. The exit ticket won't let them stop at a vague impression; they have to name one lasting change and defend it with a fact from the lesson.
Every lesson on this site is free to download and use. If one of them saved you a prep period, you can chip in a few bucks toward my three kids' daycare fund. That's genuinely where tips go.