Recession Compared 2008 vs 2020 vs 2024
Slides
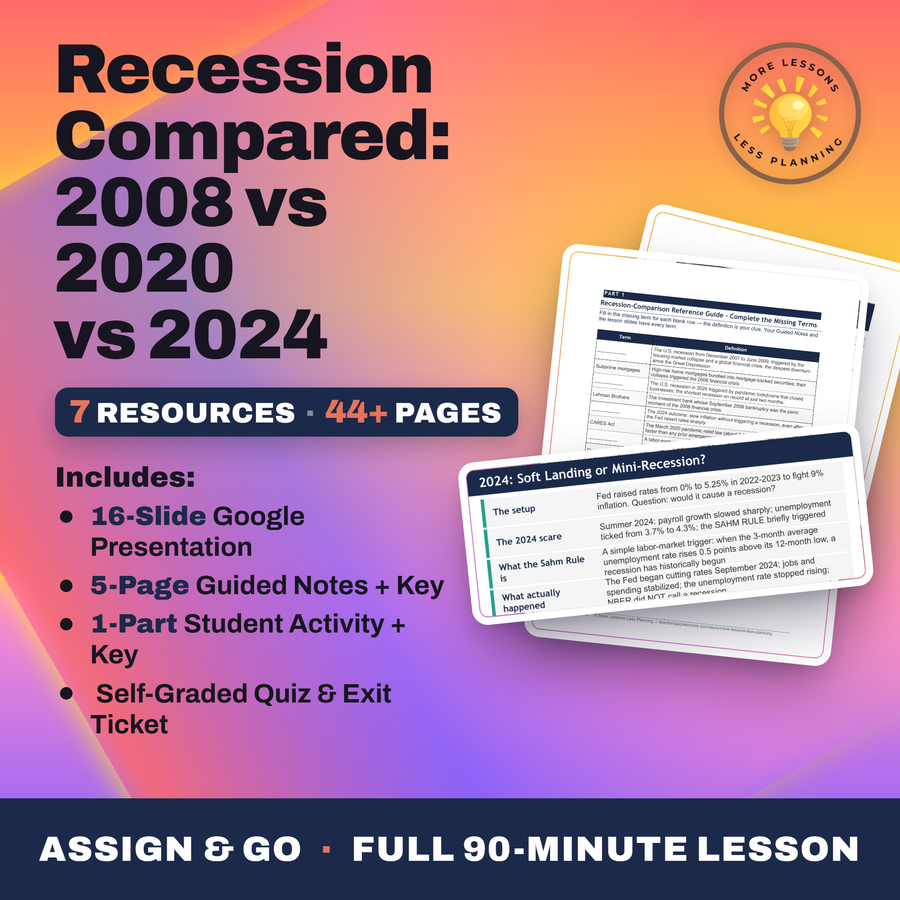
Three overlay charts anchor the comparison, unemployment, the S&P 500, and GDP, all lined up against their own pre-recession peaks. A 14.7 percent unemployment high in 2020 topped 2008's 10.0 percent, yet the recovery moved faster once the Sahm Rule and the soft landing debate get their own slide.
Download the Slides
PowerPoint (.pptx)
Where should I send the next one?
Everything here is free and it stays that way. Leave your email and I'll send you the new lessons as they go up. You can unsubscribe from any one of them.
Did this save you a prep period? You can chip in toward my three kids' daycare fund. Everything on this site stays free either way.