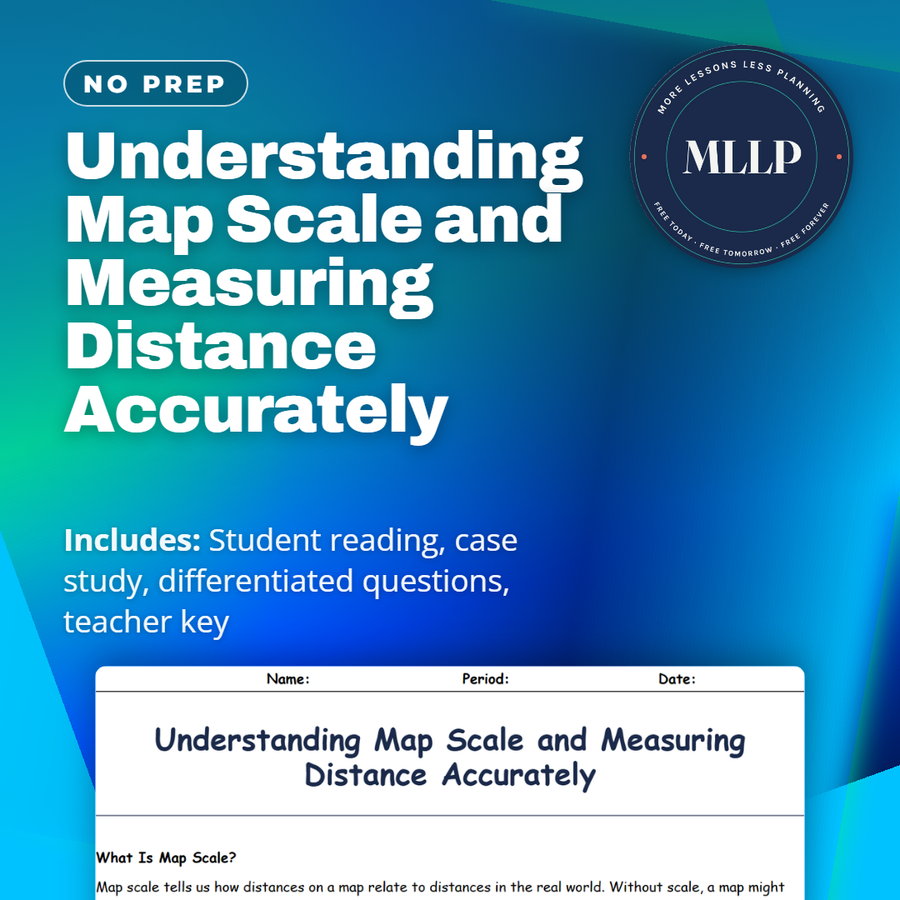
Understanding Map Scale and Measuring Distance Accurately
Quality reviewed September 2026
Facts verified September 14, 2026
- Subject
- Social Studies
- Grades
- Grades 9-12
- Length
- 6-page student worksheet
- Time
- About one 50-minute class period
- Great for
- Sub plans and independent work
- Includes
- Reading passage, comprehension questions + full answer key
- Format
- Print-and-go PDF
What students do
- Match terms like map legend, scale bar, small-scale map, large-scale map, and cartographic error to their correct definitions
- Fill in the blank sentences on graphic scale, verbal scale, and the kind of scale used to show an entire continent
- Answer multiple choice questions on what a large-scale map shows, what a representative fraction like 1 to 50,000 means, and why graphic scales stay accurate when resized
- Write short answers on why city planning needs large-scale maps, how small-scale maps help travelers, and how scale errors could affect conservation efforts
What it covers
- The three ways scale appears on a map, verbal scale, graphic scale, and representative fraction
- Why large-scale maps show small areas in detail while small-scale maps cover large areas with less detail
- A case study on park architects who caught a scale error after their printed map was accidentally resized
Start reading this worksheet
What Is Map Scale?
Map scale tells us how distances on a map relate to distances in the real world. Without scale, a map might look visually correct but be misleading in terms of how far apart locations actually are. Scales can appear in different formats—like a statement (“1 inch = 10 miles”), a graphic scale (a simple bar you can measure against), or a representative fraction (1:10,000, meaning one unit on the map represents 10,000 of the same units on Earth). This fundamental concept allows everyone from hikers to civil engineers to interpret map distances accurately.
Large Scale vs. Small Scale
It’s a common misconception that a “large-scale map” shows a big area. In fact, “large scale” means the ratio of map distance to ground distance is large, allowing you to see a smaller region with great detail. For example, a map of a single city block might be 1:1000, a large scale that reveals building footprints and sidewalks. A “small-scale map,” conversely, might be 1:5,000,000, covering entire countries with less detail—cities become dots, and roads might disappear entirely. Understanding this distinction helps in choosing the right map for the task. If you’re planning a road trip across a continent, a small-scale map offers an overview, marking major highways and landmarks. But if you’re navigating city streets, a large-scale map is indispensable for spotting one-way roads, alleyways, or the exact locations of train stations.
Types of Scale Representations
Verbal Scale: Stating “one inch equals five miles” is intuitive. You can measure an inch on the map and know it translates to five miles on the ground. However, if you enlarge or reduce the map (for instance, by photocopying), this verbal statement might no longer be accurate. Graphic Scale: A bar drawn on the map labeled with real-world distances. If the map is shrunk or enlarged, the scale bar shrinks or enlarges proportionally, remaining valid. Representative Fraction (RF): Shown as something like 1:50,000. This indicates that one unit of measurement (inch, centimeter, etc.) on the map corresponds to 50,000 of the same units on Earth. While very precise, it requires some calculation to convert to everyday measurements (like miles or kilometers).
Like what you read? The full reading, the case study, and every question set are in the free download below, along with the answer key.
Why this matters
A city park design can go wrong for a reason that has nothing to do with plants or benches, if the map it was drawn from gets resized without anyone noticing. That is what happened to the park architects here, whose measurements were off until they switched to a representative fraction and a graphic scale bar that stays accurate no matter how the map is resized. Verbal scale, graphic scale, and fractions like 1 to 50,000 are three ways of saying the same thing.
I like using a case where a scale error nearly threw off a real design, because it makes an abstract ratio feel like it carries stakes. Once students see why a large-scale map serves a city planner while a small-scale map serves a traveler, they stop treating every map as interchangeable.
From one teacher to another
This worksheet covers map scale, including the difference between large-scale and small-scale maps and the three ways scale gets represented on paper. The case study follows a team designing a city park who discovered their printed map had been resized, throwing off their measurements until they switched to a representative fraction and graphic scale bar. Students work through why that mix-up happened and what fixed it. I like that it shows a scale error with real consequences instead of just an abstract ratio. This pairs well with a unit on cartography or map-reading skills.
What you get
Download
Where should I send the next one?
Everything here is free and it stays that way. Leave your email and I'll send you the new lessons as they go up. You can unsubscribe from any one of them.
Related resources
Cartography Basics: How Maps Are Made and Interpreted
Latitude and Longitude: How to Find Any Point on Earth
Map Projections and Distortions: Why the World Isn’t Flat
Political vs. Physical Maps: What They Show and Why It Matters
Spatial Thinking and Geographic Inquiry: Asking the Right Questions
The Five Themes of Geography: Making Sense of Our World
Every lesson on this site is free to download and use. If one of them saved you a prep period, you can chip in a few bucks toward my three kids' daycare fund. That's genuinely where tips go.