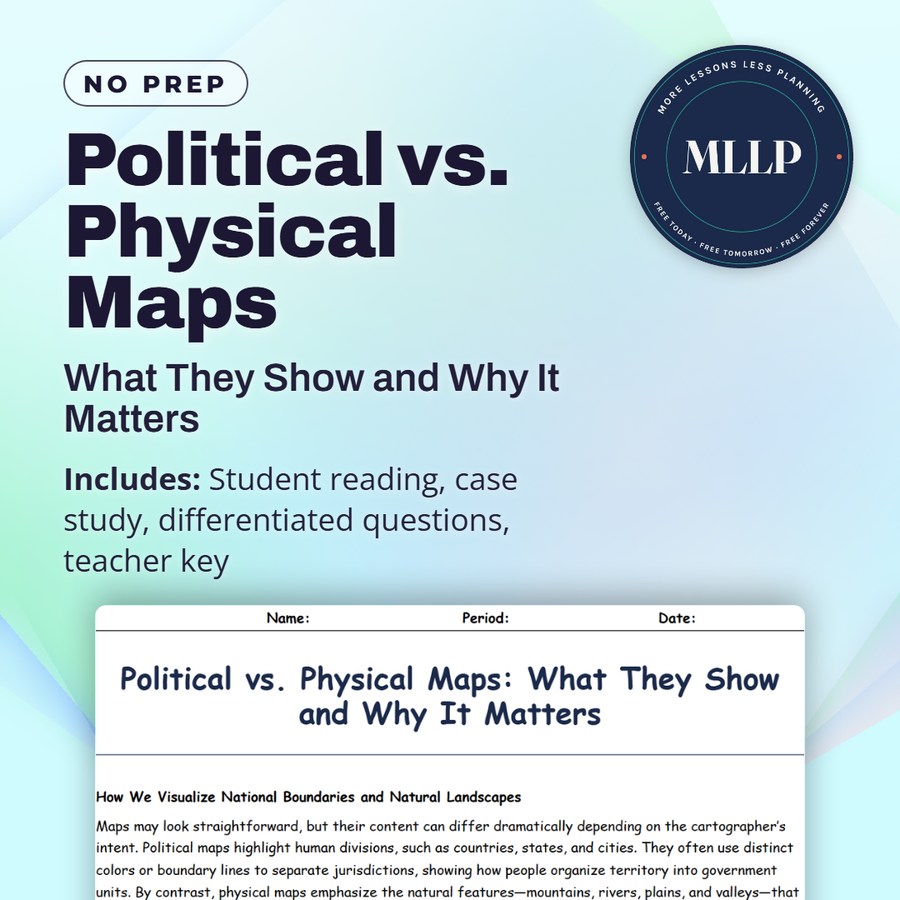
Political vs. Physical Maps: What They Show and Why It Matters
Quality reviewed September 2026
Facts verified September 14, 2026
- Subject
- Social Studies
- Grades
- Grades 9-12
- Length
- 7-page student worksheet
- Time
- About one 50-minute class period
- Great for
- Sub plans and independent work
- Includes
- Reading passage, comprehension questions + full answer key
- Format
- Print-and-go PDF
What students do
- Match terms like capital city, boundary line, topography, drainage basin, and relief to their correct definitions
- Fill in the blank sentences on political maps, physical maps, and how rivers and mountains can serve as natural borders
- Answer multiple choice questions on what political maps are used for, what physical maps show through color gradients, and a key limitation of political maps
- Write short answers on when someone might need both map types, why borders don't always follow geography, and how physical maps help with infrastructure planning
What it covers
- How political maps show human-defined borders, cities, and capitals
- How physical maps show natural landscapes, elevation, and water bodies through color gradients
- A case study on the KAZA cross-border conservation area spanning five African countries and shared ecosystems
Start reading this worksheet
How We Visualize National Boundaries and Natural Landscapes
Maps may look straightforward, but their content can differ dramatically depending on the cartographer’s intent. Political maps highlight human divisions, such as countries, states, and cities. They often use distinct colors or boundary lines to separate jurisdictions, showing how people organize territory into government units. By contrast, physical maps emphasize the natural features, such as mountains, rivers, plains, and valleys, that shape a region’s ecology and climate. Although both types of maps portray the same planet, each one tells a very different story.
Political Maps: Borders, Cities, and Shifting Lines
Politics shape our lives in ways large and small, from citizenship rules to voting districts. A political map thus illustrates how humans distribute power and resources across space. Countries are colored distinctly, and boundary lines are drawn to clarify where one sovereignty ends and another begins. Major cities are often indicated with dots of varying sizes, reflecting population or administrative importance. Meanwhile, capitals frequently stand out with special symbols. Beyond national borders, political maps may depict internal divisions like states, provinces, or counties, each with its own color or boundary line. Historically, these lines can shift over time because of treaties, wars, or negotiations. Political maps are crucial for anyone needing clarity on legal or administrative zones, like tourists checking visa requirements or companies assessing where they must pay taxes. In news reports, political maps often show conflict zones or disputed territories, reminding us that these lines can be contested.
Physical Maps: Elevation and Natural Landscapes
In contrast, physical maps focus on the Earth’s natural appearance. Color gradients might show elevation, with greens indicating lowlands and browns or whites representing higher elevations or snow-capped mountains. Rivers, lakes, and ocean depths frequently appear in varying shades of blue, giving a visual sense of water flow and depth. Physical maps also highlight deserts, forests, or other major ecosystems, explaining why certain regions might have abundant agriculture while others remain largely uninhabited. Such maps are invaluable for hikers, environmental researchers, and anyone curious about the shape of the land. They reveal natural corridors that influence everything from animal migrations to cultural exchanges. If a mountain range acts as a barrier, you might find distinct cultural groups on each side. Physical features also affect weather patterns, with tall mountain ranges possibly blocking moist air and creating rain shadows on their leeward sides. By grasping how terrain is laid out, we better understand resource distribution, settlement patterns, and climate variations.
Like what you read? The full reading, the case study, and every question set are in the free download below, along with the answer key.
Why this matters
A wildlife corridor does not stop at a national border just because a map draws a line there. The KAZA conservation area spans five African countries that cooperate to protect ecosystems that cross their political boundaries, which is the tension between political maps and physical maps in miniature. One shows where a country's authority ends, the other shows where the land and animals actually are.
Students usually think a map is just a map, so I ask which one they would use to plan a road versus which one they would use to settle a dispute. KAZA gives them a real example of five governments choosing to manage physical geography together instead of letting political lines dictate conservation.
From one teacher to another
This worksheet breaks down the difference between political maps, which show borders and cities, and physical maps, which show terrain and natural features. The case study looks at the KAZA conservation area in southern Africa, where five countries cooperate to protect wildlife that crosses their borders. Students see how political and physical realities can align or conflict depending on how boundaries were drawn. I like that it gives a concrete example of why geography matters beyond just naming borders. This pairs well with a unit on political geography or conservation.
What you get
Download
Where should I send the next one?
Everything here is free and it stays that way. Leave your email and I'll send you the new lessons as they go up. You can unsubscribe from any one of them.
Related resources
Cartography Basics: How Maps Are Made and Interpreted
Latitude and Longitude: How to Find Any Point on Earth
Map Projections and Distortions: Why the World Isn’t Flat
Spatial Thinking and Geographic Inquiry: Asking the Right Questions
The Five Themes of Geography: Making Sense of Our World
Time Zones and the Prime Meridian: A Global Clock System
Every lesson on this site is free to download and use. If one of them saved you a prep period, you can chip in a few bucks toward my three kids' daycare fund. That's genuinely where tips go.