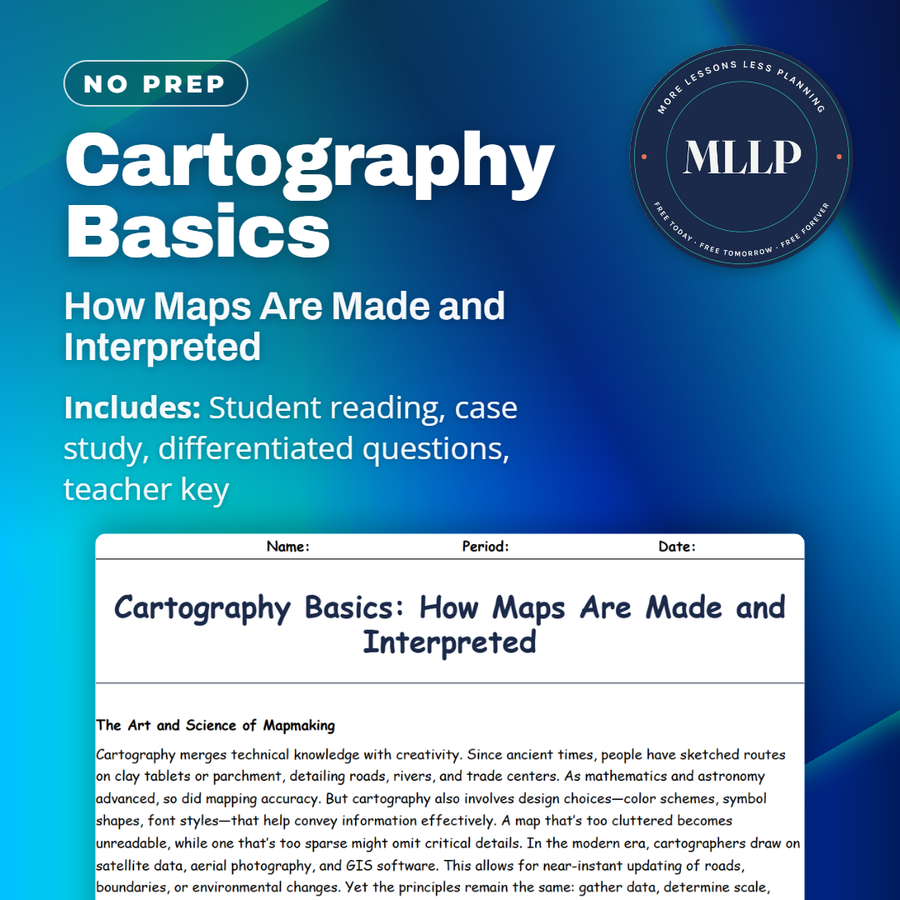
Cartography Basics: How Maps Are Made and Interpreted
Quality reviewed September 2026
Facts verified September 14, 2026
- Subject
- Social Studies
- Grades
- Grades 9-12
- Length
- 7-page student worksheet
- Time
- About one 50-minute class period
- Great for
- Sub plans and independent work
- Includes
- Reading passage, comprehension questions + full answer key
- Format
- Print-and-go PDF
What students do
- Match terms like aerial photography, scale bar, compass rose, and data accuracy to their correct definitions
- Fill in the blank sentences on GIS, legends, and the different shades of blue used to show flood risk scenarios
- Answer multiple choice questions on what cartography means, what a legend shows, and how GIS contributes to modern mapmaking
- Write short answers on why symbol design matters, how cartographers choose color schemes, and the tradeoffs of crowd-sourced mapping data
What it covers
- The art and science of cartography, from early sketches to satellite data and GIS software
- The core elements of a map, including the title, legend, scale bar, compass rose, and symbols
- A case study on mapping coastal flood risk scenarios using GIS layers and color-coded zones
Start reading this worksheet
The Art and Science of Mapmaking
Cartography merges technical knowledge with creativity. Since ancient times, people have sketched routes on clay tablets or parchment, detailing roads, rivers, and trade centers. As mathematics and astronomy advanced, so did mapping accuracy. But cartography also involves design choices that help convey information effectively, such as color schemes, symbol shapes, and font styles. A map that’s too cluttered becomes unreadable, while one that’s too sparse might omit critical details. In the modern era, cartographers draw on satellite data, aerial photography, and GIS software. This allows for near-instant updating of roads, boundaries, or environmental changes. Yet the principles remain the same: gather data, determine scale, project the spherical Earth, add symbols and labels, and present the final product so users can easily extract meaning.
Core Elements of a Map
Title: Identifies the map’s subject, such as “Population Density of Europe” or “Mount Rainier Hiking Trails.” Legend (Key): Explains the symbols, colors, or patterns used. Without it, a viewer might not understand if a red line indicates a highway or a railroad. Scale Bar: Shows how map distances translate to real-world distances. Compass Rose: Indicates direction (North, South, East, West). Even in digital maps with automatic orientation, a simple direction arrow can be useful. Symbols and Labels: Convey roads, cities, rivers, national parks, and more. Each symbol should be distinct enough that a quick glance at the legend clarifies its meaning.
Like what you read? The full reading, the case study, and every question set are in the free download below, along with the answer key.
Why this matters
Shades of blue on a flood risk map are not decorative, they mark different flood risk zones, and getting that choice wrong changes how people respond. That design decision is where this reading lives, treating the scale bar, legend, and compass rose as tools with real consequences.
Most students assume a map is just an accurate picture of the world, so the tradeoffs behind crowd-sourced data and color choices catch them off guard. Working through the GIS flood risk case study leaves them reading every map afterward with a more skeptical eye toward who made it.
From one teacher to another
This reading walks students through the basics of cartography, from the history of mapmaking to the core elements every map needs, like the title, legend, scale bar, compass rose, and symbols. The case study on mapping coastal flood risk shows how cartographers use GIS to layer data and communicate risk clearly. I like that it pairs the technical vocabulary with a real decision-making scenario, since it gives students something concrete to reason through. This fits well in a unit introducing basic map-reading and GIS concepts.
What you get
Download
Where should I send the next one?
Everything here is free and it stays that way. Leave your email and I'll send you the new lessons as they go up. You can unsubscribe from any one of them.
Related resources
Latitude and Longitude: How to Find Any Point on Earth
Map Projections and Distortions: Why the World Isn’t Flat
Political vs. Physical Maps: What They Show and Why It Matters
Spatial Thinking and Geographic Inquiry: Asking the Right Questions
The Five Themes of Geography: Making Sense of Our World
Time Zones and the Prime Meridian: A Global Clock System
Every lesson on this site is free to download and use. If one of them saved you a prep period, you can chip in a few bucks toward my three kids' daycare fund. That's genuinely where tips go.