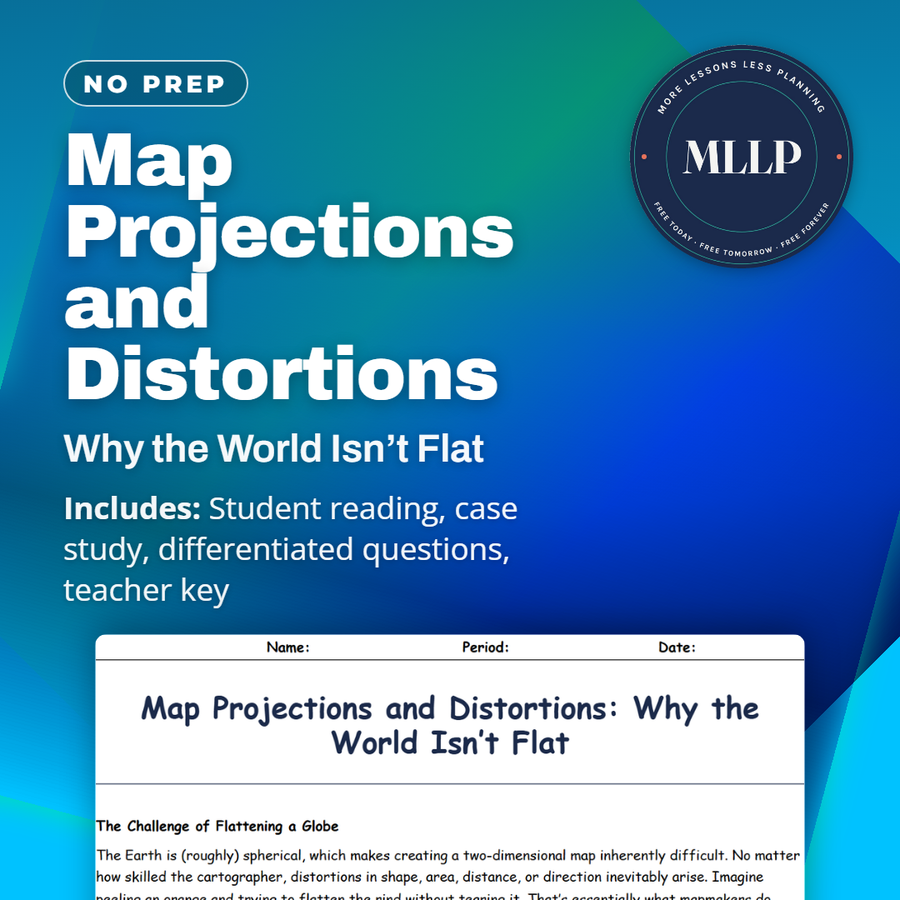
Map Projections and Distortions: Why the World Isn’t Flat
Quality reviewed September 2026
Facts verified September 14, 2026
- Subject
- Social Studies
- Grades
- Grades 9-12
- Length
- 7-page student worksheet
- Time
- About one 50-minute class period
- Great for
- Sub plans and independent work
- Includes
- Reading passage, comprehension questions + full answer key
- Format
- Print-and-go PDF
What students do
- Match terms like great-circle route, rhumb lines, area distortion, and the gnomonic projection to their correct definitions
- Fill in the blank sentences on what a map projection is, equal-area projections, and how the Mercator projection preserves angles
- Answer multiple choice questions on the main flaw of the Mercator projection, what equal-area projections show, and why the Robinson projection works for classroom maps
- Write short answers on why no projection is perfect, when an equal-area projection matters most, and how comparing projections builds critical thinking
What it covers
- Why flattening a sphere into a map always creates distortion in shape, area, distance, or direction
- The Mercator, Robinson, and Peters projections and what each one preserves or distorts
- A case study on a school district's debate over switching classroom maps from Mercator to Peters
Start reading this worksheet
The Challenge of Flattening a Globe
The Earth is (roughly) spherical, which makes creating a two-dimensional map inherently difficult. No matter how skilled the cartographer, distortions in shape, area, distance, or direction inevitably arise. Imagine peeling an orange and trying to flatten the rind without tearing it. That’s essentially what mapmakers do when they craft map projections; each is a mathematical compromise that preserves some qualities while sacrificing others. One of the oldest and most famous is the Mercator projection, developed in the 16th century. It’s excellent for navigation because it preserves angles, meaning a straight line on this map corresponds to a constant compass bearing. However, it vastly inflates the size of regions near the poles, making Greenland appear rival to Africa in area when, in reality, Africa is roughly fourteen times larger. Such distortions have cultural implications; visually large areas might be (incorrectly) assumed to be more significant on a global scale.
Different Projections for Different Purposes
Because no projection is perfect, cartographers choose based on intended use. The Robinson projection attempts a more balanced view, spreading distortion somewhat evenly so that continents appear in more reasonable proportions while not preserving any single metric perfectly. Classrooms commonly use it for world maps because it “looks right” in an overall sense. The Peters projection focuses on equal-area representation, so landmasses retain their true relative sizes. Critics argue that its shapes become oddly stretched vertically or horizontally, making some continents appear elongated. Yet for educators wanting to emphasize the real size of developing nations in Africa and South America, Peters is a strong choice. Other specialized projections exist for tasks like air route planning, such as the gnomonic projection, which represents great-circle routes as straight lines. This is valuable for pilots plotting the shortest distance over Earth’s curvature.
Like what you read? The full reading, the case study, and every question set are in the free download below, along with the answer key.
Why this matters
Every map a student has looked at is wrong in some provable way, since flattening a sphere always distorts shape, area, distance, or direction. A school district found that out switching classroom maps from Mercator to Peters, when parents pushed back over how different countries looked.
I like handing students a real disagreement instead of a rule. Reading both sides forces them to ask what a map is for: everyday navigation favors Mercator, comparing true country size favors a projection built to preserve area instead.
From one teacher to another
This worksheet gets into why every map projection is a trade-off, comparing Mercator, Robinson, and Peters side by side. The case study covers a school district's debate after switching classroom maps, where parents pushed back over how distorted the new maps looked. Students read both sides before answering questions on area distortion, angles, and why cartographers pick different projections for different jobs. I like that it gives students a concrete debate to reason through instead of just memorizing map types. This works well alongside a lesson on cartography or geographic bias.
What you get
Download
Where should I send the next one?
Everything here is free and it stays that way. Leave your email and I'll send you the new lessons as they go up. You can unsubscribe from any one of them.
Related resources
Cartography Basics: How Maps Are Made and Interpreted
Latitude and Longitude: How to Find Any Point on Earth
Political vs. Physical Maps: What They Show and Why It Matters
Spatial Thinking and Geographic Inquiry: Asking the Right Questions
The Five Themes of Geography: Making Sense of Our World
Time Zones and the Prime Meridian: A Global Clock System
Every lesson on this site is free to download and use. If one of them saved you a prep period, you can chip in a few bucks toward my three kids' daycare fund. That's genuinely where tips go.