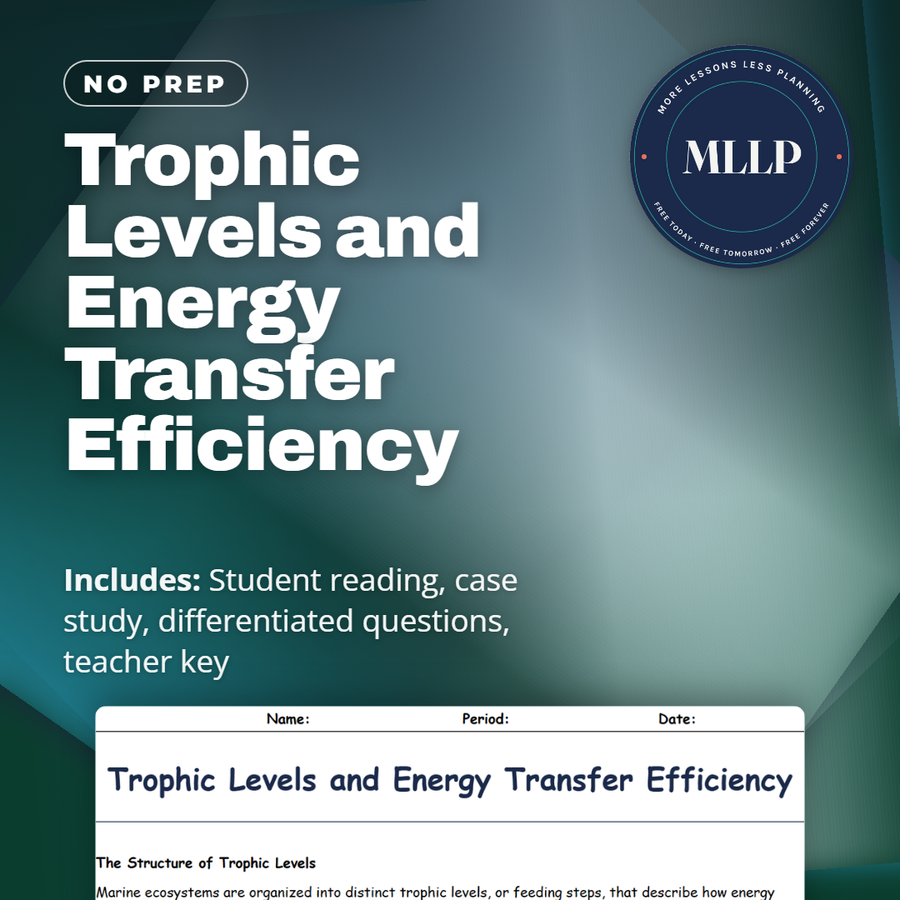
Trophic Levels and Energy Transfer Efficiency
Quality reviewed September 2026
Facts verified September 14, 2026
- Subject
- Science
- Grades
- Grades 9-12
- Length
- 6-page student worksheet
- Time
- About one 50-minute class period
- Great for
- Sub plans and independent work
- Includes
- Reading passage, comprehension questions + full answer key
- Format
- Print-and-go PDF
What students do
- Match terms like producers, primary consumers, secondary consumers, tertiary consumers, and apex predators to their correct trophic level
- Fill in the blank sentences on the 10% rule, the biomass pyramid, and trophic cascades
- Answer multiple choice questions on the percentage of energy passed between trophic levels and why food chains rarely exceed five levels
- Write short answers and case study questions on why whales need more energy than fish and the collapse of Atlantic cod
What it covers
- The structure of trophic levels from producers to apex predators
- The 10% rule and why energy loss limits the number of levels a food chain can support
- A case study on the collapse of Atlantic cod and how it disrupted energy flow across trophic levels
Start reading this worksheet
The Structure of Trophic Levels
Marine ecosystems are organized into distinct trophic levels, or feeding steps, that describe how energy flows from one group of organisms to another. At the base are producers, like phytoplankton, that capture sunlight and convert it into chemical energy. The next step is occupied by primary consumers such as zooplankton that feed directly on producers. Above them are secondary consumers like small fish, followed by tertiary consumers such as tuna, and at the very top are apex predators, including sharks and orcas. Each level is connected by the transfer of energy through feeding. The number of levels in a food chain is limited by the efficiency of energy transfer. Unlike matter, which cycles continuously, energy moves in a single direction and diminishes at each step. This structure explains why ecosystems support many producers but far fewer top predators.
The 10% Rule and Energy Loss
Ecologists often summarize energy transfer with the “10% rule.” On average, only about 10% of the energy available at one trophic level is passed on to the next. The remaining 90% is lost to heat, respiration, growth, and daily activities like movement and reproduction. For example, phytoplankton capture solar energy, but much of it is used for their own cellular processes. When zooplankton consume them, only a small portion of that energy becomes new biomass that can be eaten by small fish. This inefficiency means that the biomass pyramid of the ocean has a wide base of producers, fewer herbivores, even fewer carnivores, and a narrow top of apex predators. This pyramid shape can shift depending on local conditions, but the principle of energy loss remains constant.
Ecological Implications of Energy Flow
Because energy transfer is inefficient, food chains rarely exceed four or five trophic levels. Longer chains would leave too little energy at the top to sustain predators. This principle has major ecological consequences. It means that protecting producers is critical for maintaining entire ecosystems, and that declines in lower trophic levels can rapidly affect higher ones. For example, a collapse in sardine populations can impact tuna, seabirds, and marine mammals that rely on them as food. The efficiency of energy transfer also determines the carrying capacity of each level. Large populations of top predators require enormous amounts of prey and, in turn, an even larger base of producers. When this balance is disrupted, ecosystems can lose stability.
Like what you read? The full reading, the case study, and every question set are in the free download below, along with the answer key.
Why this matters
Only about ten percent of the energy available at one feeding level survives the jump to the next, which is why a marine food chain almost never runs past five levels and why apex predators like sharks and orcas stay rare compared to the phytoplankton at the bottom. That same math explains why removing one predator can rearrange an entire system instead of leaving a single empty spot.
Students usually assume a fishery just needs time to recover once fishing stops, so I follow the energy math with the Atlantic cod collapse. Removing cod let mid-level prey species expand into the niche cod used to fill, and that shift is a real reason the fishery still has not recovered.
From one teacher to another
Energy loss between feeding levels is the subject of this reading on trophic levels in marine ecosystems. Students see how the 10% rule explains why the ocean supports huge numbers of phytoplankton but only a small number of apex predators like sharks and orcas. The case study covers the collapse of Atlantic cod stocks, showing how removing a top consumer let mid-level prey species expand and kept the fishery from recovering.
What you get
Download
Where should I send the next one?
Everything here is free and it stays that way. Leave your email and I'll send you the new lessons as they go up. You can unsubscribe from any one of them.
Related resources
Abiotic and Biotic Factors Shaping Marine Ecosystems
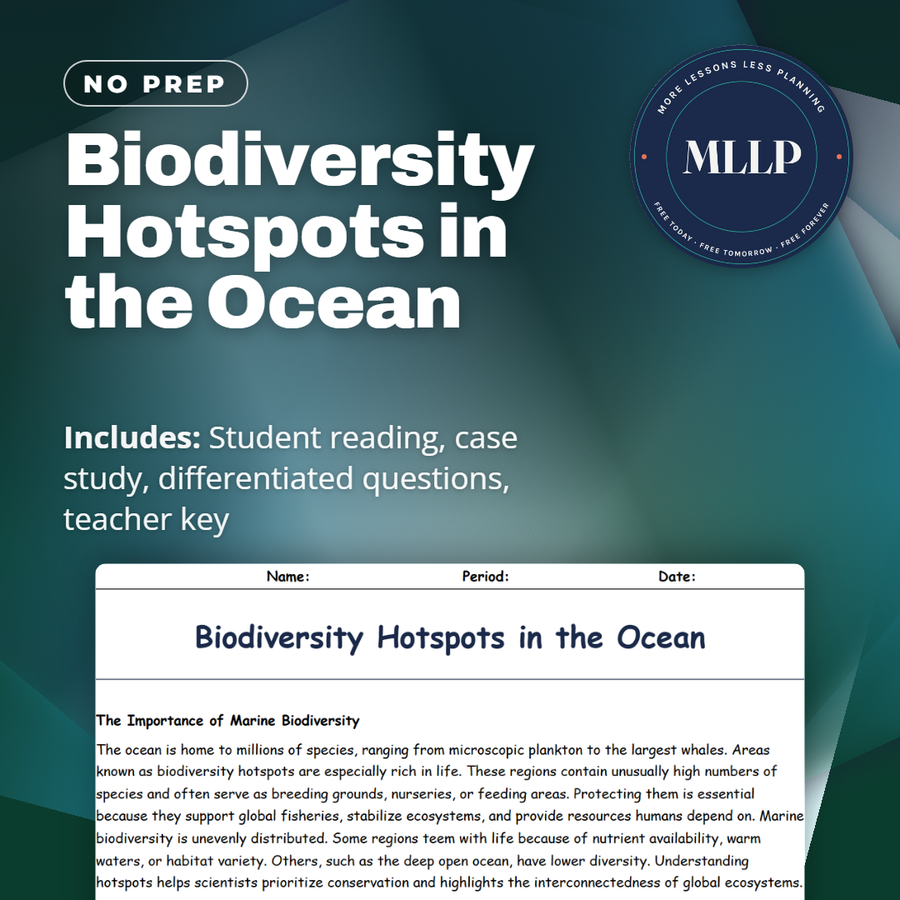
Biodiversity Hotspots in the Ocean
Ecological Niches and Competition in Marine Ecosystems
Ecosystem Principles: How Marine Life Interacts and Survives
Human Influences on Marine Ecosystems
Keystone Species and Their Role in Ecosystem Balance
Every lesson on this site is free to download and use. If one of them saved you a prep period, you can chip in a few bucks toward my three kids' daycare fund. That's genuinely where tips go.