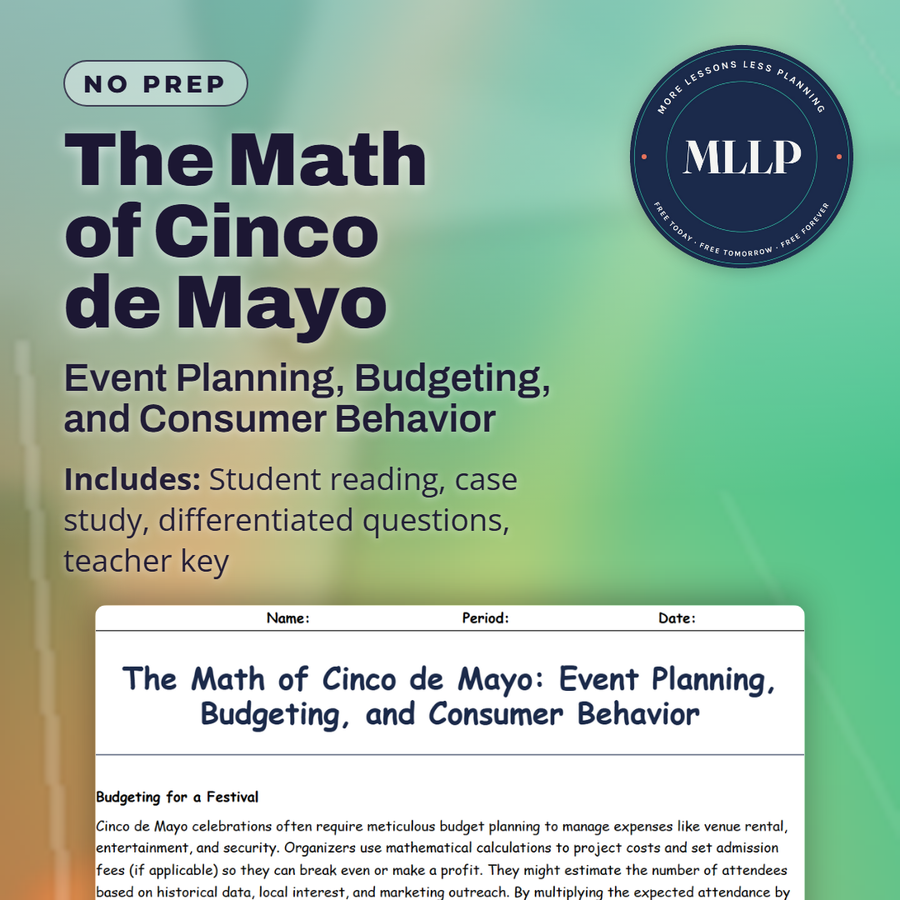
The Math of Cinco de Mayo: Event Planning, Budgeting, and Consumer Behavior
Quality reviewed September 2026
Facts verified September 9, 2026
- Subject
- Math
- Grades
- Grades 9-12
- Length
- 7-page student worksheet
- Time
- About one 50-minute class period
- Great for
- Sub plans and independent work
- Includes
- Reading passage, comprehension questions + full answer key
- Format
- Print-and-go PDF
What students do
- Calculate fixed and variable costs to determine break-even points and profit projections
- Analyze pricing strategies using supply and demand to maximize both attendance and revenue
- Forecast attendance using historical data, demographics, and social media metrics
- Apply percentages and cost-volume-profit relationships to vendor sales predictions
What it covers
- Budget forecasting and cost analysis
- Supply and demand pricing strategies
- Consumer spending patterns and profit margins
Start reading this worksheet
Budgeting for a Festival
Cinco de Mayo celebrations often require meticulous budget planning to manage expenses like venue rental, entertainment, and security. Organizers use mathematical calculations to project costs and set admission fees (if applicable) so they can break even or make a profit. They might estimate the number of attendees based on historical data, local interest, and marketing outreach. By multiplying the expected attendance by the ticket price, they get a rough revenue forecast. This revenue projection helps them allocate funds to various needs. For example, if they expect 1,000 attendees paying $5 each, that’s $5,000 in gross revenue. Subtracting fixed costs (like $1,500 for renting a public park) and variable costs (like $2 per attendee for decorations and snacks) clarifies whether the festival is financially viable. Such calculations illustrate real-world applications of algebraic equations and cost analysis, often taught in consumer math or personal finance classes. Timing also influences budgeting. Weekend celebrations may incur higher labor costs if staff require overtime pay. Additionally, prime vendors or performers may charge more for peak holiday slots. Students exploring these scenarios can apply concepts like percentages, ratios, and margins to break down how each factor impacts overall profitability.
Pricing and Ticket Sales
One significant question for organizers is setting a ticket price that balances affordability and revenue goals. Price it too high, and attendance might drop; too low, and the event may not cover its costs. Economic models like supply and demand come into play as planners look for the sweet spot where maximum attendance coincides with profitable pricing. In some cases, organizers introduce tiered pricing (e.g., early bird specials or VIP experiences) to capture different consumer segments. Data from previous Cinco de Mayo events can guide price decisions. If a similar festival charged $8 for entry and saw a turnout of 800 visitors, the total revenue would be $6,400. Organizers can experiment with hypothetical scenarios: what if the price drops to $6 and attendance rises to 1,100? While that revenue becomes $6,600, they must factor in increased variable costs. This analysis leads to discussions about cost-volume-profit relationships and break-even points. Additionally, intangible factors like the festival’s reputation and perceived value of entertainment influence pricing. A well-known band or elaborate fireworks display might justify higher ticket costs. In contrast, a smaller neighborhood event may benefit from lower or even free admission, relying on donations, grants, or concession sales to cover expenses.
Forecasting Attendance and Resource Allocation
Predicting how many people will attend a Cinco de Mayo celebration can be challenging. Planners often look at historical attendance, local demographics, and the success of marketing efforts. They might conduct surveys or analyze social media metrics to gauge interest. Each data point helps refine the forecast, improving accuracy. Once an attendance figure is estimated, resource allocation becomes more precise. Organizers can decide how many food vendors they need, how much security to hire, and how many portable restrooms to provide. Too few resources lead to overcrowding and dissatisfaction; too many result in wasted funds. Mathematical tools like probability and regression analysis can help refine these forecasts, although smaller community events might use simpler methods—like a 20% increase over last year’s turnout if local interest is rising. Festivals that want to manage crowd flow often employ queue theory—the mathematical study of waiting lines—to optimize entrance gates or concession stands. By calculating average service rates and arrival times, they can adjust staff levels to reduce wait times. This approach requires real-time data analysis, offering a practical lesson in how mathematics underpins even the most festive occasions.
Like what you read? The full reading, the case study, and every question set are in the free download below, along with the answer key.
Why this matters
Every school club that plans a fundraiser hits the same wall: a price that sounds fair on paper stops working once real people show up. This case study priced tickets at $5, projected 300 attendees, and budgeted $600 in fixed costs, only to have 350 people show up and beat the estimate.
Students who have only ever managed an allowance rarely see cost as more than one number. I watch that shift when they trace fixed costs, variable costs, and a promotional deal pulling against each other, then learn the club could have charged $6 without losing a guest.
From one teacher to another
Students see real numbers in this worksheet. A case study about a high school business club organizing a festival starts with surveys: they found $5 was the optimal ticket price for their budget-conscious audience. Based on prior events, they projected 300 attendees, landing on $1,500 gross revenue. They calculated $600 in fixed costs (decorations, permits) plus $2 variable costs per person (refreshments), reaching a projected profit of $300. On the day, 350 students showed up, beating their estimate. By analyzing post-event feedback, they realized they could have charged $6 without losing attendance. Students work through these scenarios, testing what-if variations. They apply queue theory to optimize entrance gates. They calculate how a promotional offer, buy one taco, get one half-off, impacts per-item profit but might boost volume. These aren't abstract equations; they're tools for understanding how real people make decisions.
What you get
Download
Where should I send the next one?
Everything here is free and it stays that way. Leave your email and I'll send you the new lessons as they go up. You can unsubscribe from any one of them.
Related resources
American History and Cinco de Mayo: Cultural Exchange and Historical Narratives
Cinco de Mayo Biology: The Genetics and Agriculture of Mexican Cuisine
Cinco de Mayo Psychology: Identity, Celebration, and Social Dynamics
Cinco de Mayo and the Battle of Puebla: Turning Points in Mexican History
Environmental Impacts of Cinco de Mayo Celebrations: Sustainability and Festivals
The Economics of Cinco de Mayo: Celebrations, Commerce, and Cultural Commodification
Every lesson on this site is free to download and use. If one of them saved you a prep period, you can chip in a few bucks toward my three kids' daycare fund. That's genuinely where tips go.