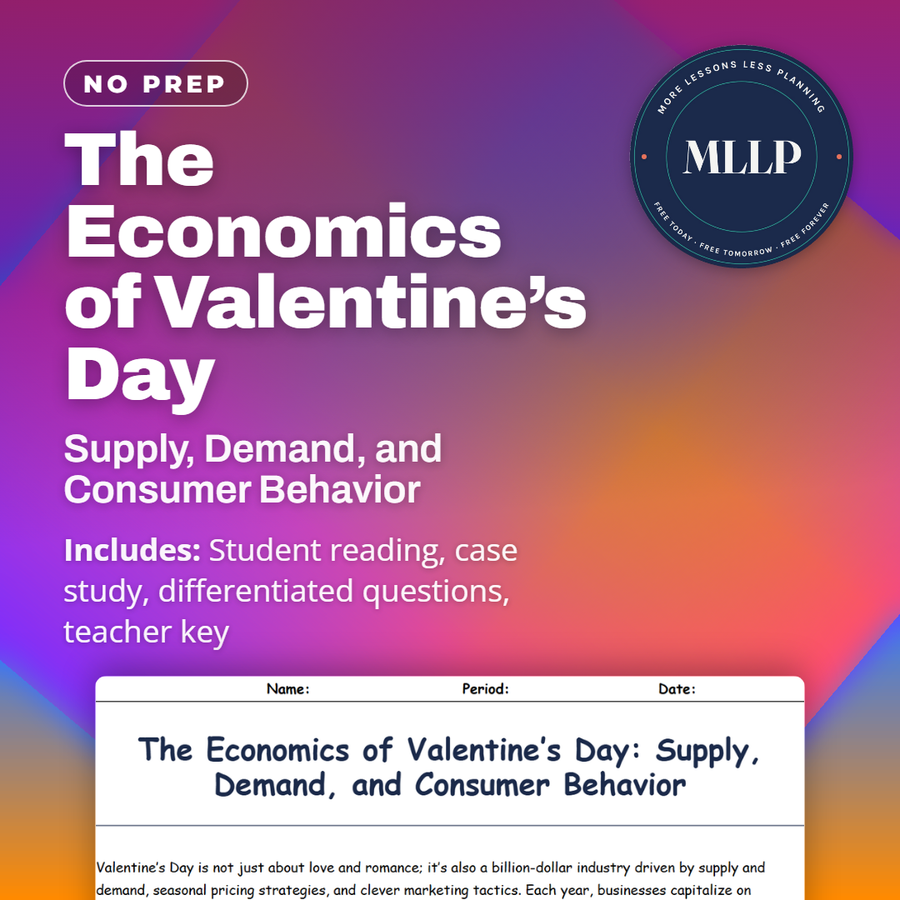
The Economics of Valentine’s Day: Supply, Demand, and Consumer Behavior
Quality reviewed September 2026
Facts verified September 9, 2026
- Subject
- Social Studies
- Grades
- Grades 9-12
- Length
- 7-page student worksheet
- Time
- About one 50-minute class period
- Great for
- Sub plans and independent work
- Includes
- Reading passage, comprehension questions + full answer key
- Format
- Print-and-go PDF
What students do
- Analyze how seasonal scarcity drives price surges in flowers and luxury goods
- Distinguish elastic demand from inelastic demand using Valentine examples
- Trace how marketing creates perceived value and social comparison pressure
- Apply economic concepts to predict how retailers influence spending behavior
What it covers
- Supply and demand during peak seasons
- Elastic versus inelastic demand and seasonal pricing
- Psychological pricing, bundling, and social media influence
Start reading this worksheet
Valentine’s Day is not just about love and romance; it’s also a billion-dollar industry driven by supply and demand, seasonal pricing strategies, and clever marketing tactics. Each year, businesses capitalize on consumers’ desire to show affection through gifts like flowers, chocolates, and greeting cards. Understanding the economic forces behind Valentine’s Day spending habits reveals how businesses anticipate and influence consumer behavior.
Supply and Demand: The Heart of Valentine’s Day Economics
During Valentine’s Day, the demand for traditional gifts like roses, chocolates, and jewelry spikes. This increased demand creates price surges, particularly for flowers. A dozen roses that might cost $20 in January can double or triple in price during the holiday. Why? Suppliers must account for seasonal labor, shipping costs, and refrigeration needed to deliver fresh flowers to stores and consumers. The supply side of the equation involves producers ramping up inventory months in advance. Farmers grow more roses during peak months, while chocolate manufacturers boost production to meet increased orders. However, because these products are perishable, companies cannot stockpile indefinitely. This limited shelf life contributes to higher prices, as businesses aim to minimize waste while maximizing profits. Seasonal elasticity also plays a role. Elastic goods, like chocolates, see greater shifts in price based on consumer demand. In contrast, luxury jewelry exhibits inelastic demand, meaning consumers are willing to pay high prices regardless of economic conditions, especially when emotions like love and guilt are at play.
Marketing Tactics and Psychological Influence
Valentine’s Day marketing campaigns are carefully designed to tap into emotions, creating a sense of urgency and exclusivity. Advertisements often highlight limited-time offers, encouraging consumers to purchase quickly. The use of psychological pricing, such as $9.99 instead of $10.00, makes products seem more affordable, even when prices are inflated. Companies also leverage consumer psychology by offering “bundled deals.” For example, stores might package chocolates, flowers, and a stuffed animal together at a slight discount compared to buying each item separately. This strategy encourages higher spending by creating the illusion of value. Additionally, social media campaigns have become a powerful tool for influencing consumer behavior. Brands often use influencers to promote Valentine’s Day products, showcasing these items as essential for expressing love. This type of marketing fosters a sense of social comparison, prompting consumers to match or exceed the perceived spending habits of their peers.
Like what you read? The full reading, the case study, and every question set are in the free download below, along with the answer key.
Why this matters
A dozen roses costs about twenty dollars in January. By February 14 the same dozen has doubled or tripled in price, and nobody blinks. Students who have never touched a supply and demand graph can still explain why a flower shop does this, because they have watched it happen every year of their lives.
None of them expect the marketing angle: the Cadbury case study shows a company that spent decades inventing a chocolate tradition rather than just selling into one. By the end they stop seeing a holiday sale as coincidence and start reading it as a system built to move more money out of their pockets.
From one teacher to another
Roses are cheap in January. A dozen for twenty bucks. Come February 14 and that price doubles or triples. Students grasp supply and demand fast when it's about flowers they see in stores. The marketing section lands hard: companies deliberately use social comparison to make people feel like they're not doing enough. The Cadbury case study shows how a business literally invented Valentine's chocolate tradition over decades. By the end, students realize every "sale" and bundled deal is part of a system designed to extract more spending, and they're equipped to see it coming.
What you get
Download
Where should I send the next one?
Everything here is free and it stays that way. Leave your email and I'll send you the new lessons as they go up. You can unsubscribe from any one of them.
Related resources

Animal Courtship Biology: Sexual Selection in the Wild
Famous Relationship Cases in Forensics: Evidence vs. Emotion in the Public Eye
Forensic Science and Domestic Violence
Forensic Science: Online Romance Scams
Government and Relationships: How Laws Have Shaped “Love” in U.S. History
Love Hormones: Oxytocin, Dopamine, and the Brain
Every lesson on this site is free to download and use. If one of them saved you a prep period, you can chip in a few bucks toward my three kids' daycare fund. That's genuinely where tips go.