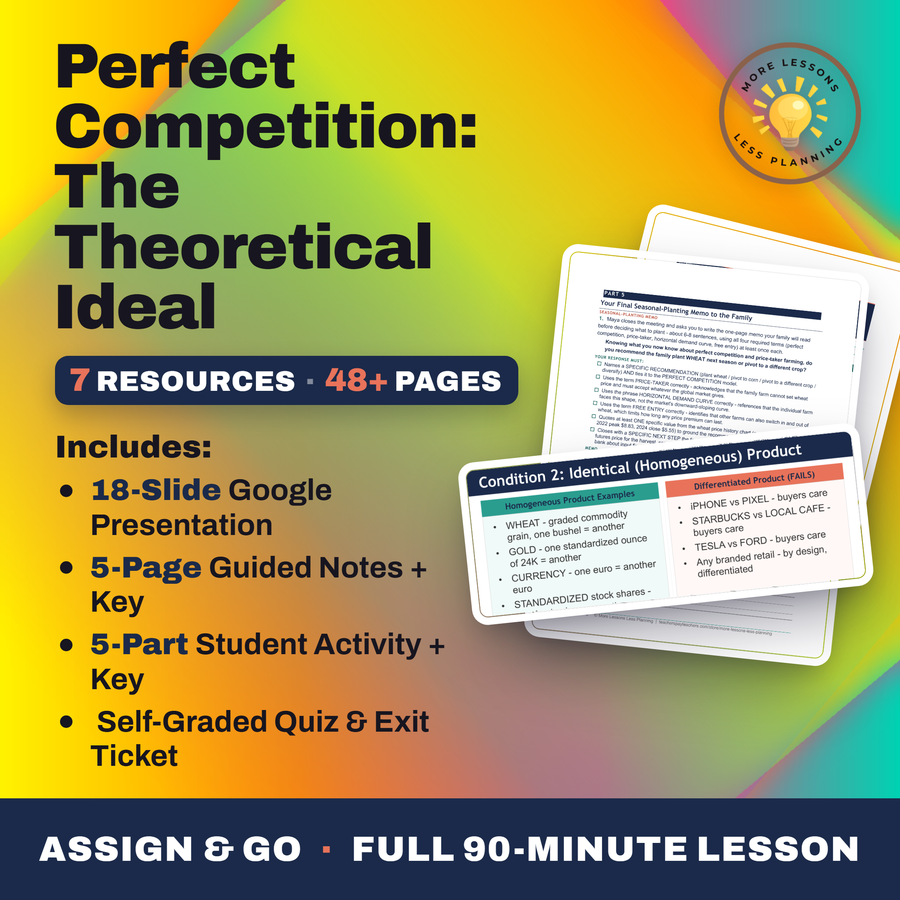
Perfect Competition: The Theoretical Ideal
Quality reviewed September 2026
- Grades
- Grades 9-12
- Time
- About two 50-minute class periods
- Includes
- 11 ready-to-teach files
- Format
- Word (.docx) · PowerPoint (.pptx)
- Slide deck
- Guided notes
- Guided notes teacher key
- Activity + answer key
- Quiz + answer key
- Exit ticket + answer key
- Teacher guide
- Teacher presentation notes
What students do
- Check a real market against the four conditions of perfect competition using the M-I-F-P mnemonic
- Compare the market-level supply and demand chart against the individual farm's horizontal demand curve
- Read a 2010-2024 wheat price chart from a $3.89 low in 2016 to an $8.83 peak after the 2022 Ukraine invasion
- Diagnose four real markets, from wheat to smartphones, against the four conditions and assign a market structure label
What it covers
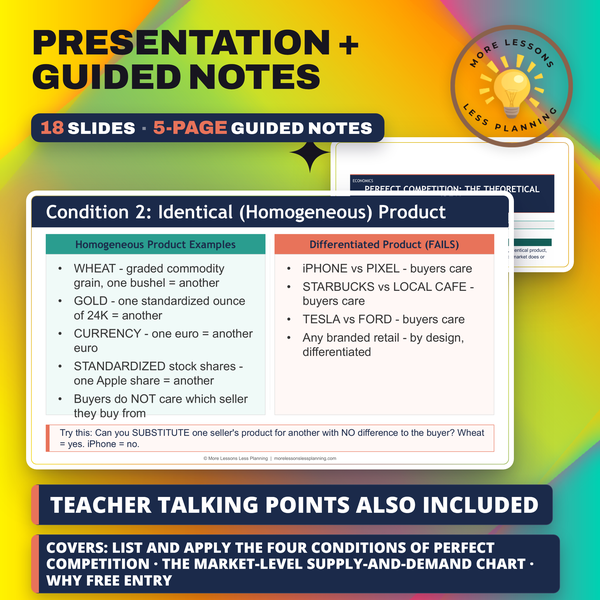
- The four conditions of perfect competition: many sellers, identical product, free entry and exit, perfect information
- Why an individual wheat farm faces a perfectly elastic, horizontal demand curve at the market price
- Long-run zero economic profit, and why free entry erodes profit while free exit relieves losses
- U.S. commodity wheat as the closest real-world fit, next to smartphones and search engines as clear failures
Learning targets
- List the FOUR conditions of perfect competition: many sellers, identical product, free entry and exit, and perfect information. Then check whether a real market meets each one.
- Tell apart two charts. The MARKET chart sets the equilibrium price. The INDIVIDUAL FIRM's horizontal demand curve shows what a price-taker actually faces.
- Explain why free entry and exit pushes long-run economic profit to zero. This is bad news for sellers. It is good news for consumers.
Peek inside
The Theoretical Benchmark
Rarely seen in pure form in the real world
Used to MEASURE every other market structure
Sets the standard for consumer-friendly outcomes
The starting point for Unit 3
The Theoretical Benchmark
Perfect competition is rarely seen in pure .
It is used to MEASURE every other structure.
It is the starting point for 3.
Real-World Closest Match
U.S. is the closest real-world fit (tens of thousands of farms).
1. A market with many sellers, an identical product, free entry and exit, and perfect information is the theoretical benchmark economists call .
Why this matters
A bushel of wheat sold for $3.89 in 2016 and $8.83 after Russia invaded Ukraine in 2022, and no single farmer caused either price. That swing is perfect competition in one chart: thousands of identical sellers, each powerless over price alone.
Every seller has some influence over price, or so students assume right up until they watch an individual farm's demand curve sit perfectly flat and horizontal. Diagnosing smartphones and search engines against the same four conditions afterward shows exactly why those markets fail the test wheat passes.
From one teacher to another
Perfect competition is the one market structure my students will basically never see in the real world, which is exactly why I anchor it in U.S. wheat farming instead of a textbook abstraction. They check wheat against all four conditions using the M-I-F-P mnemonic, then compare two very different charts side by side: the market-level supply and demand graph that sets the $7/bushel price, and the individual farm's flat, horizontal demand curve that shows it has zero power to change that price. The 2010-2024 wheat price chart does the rest of the convincing, since no single farmer caused the 2016 low or the 2022 spike from the Ukraine invasion, and by the end students are diagnosing smartphones and search engines against the same four conditions to see exactly where those markets fail.
Every file in this toolkit
-
Activity (Student)
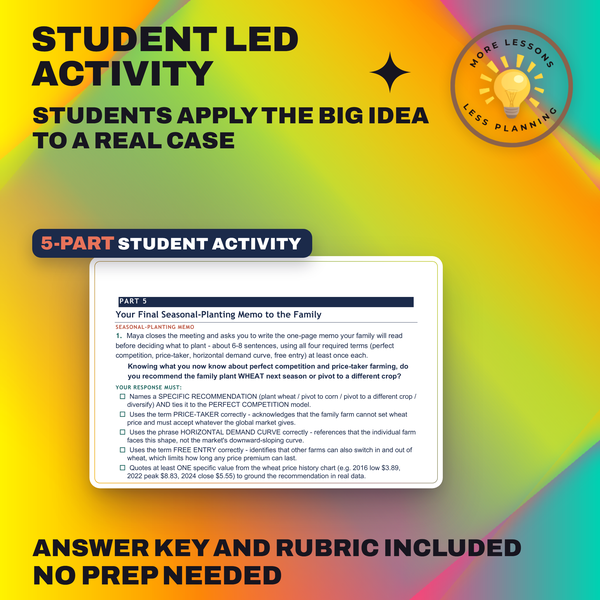
Maya has students score U.S. wheat farming against the M-I-F-P rubric, then compare the market chart's $7 equilibrium to one farm's flat demand curve. Smartphones and search engines get scored on the same rubric before a final structure label.
-
Activity (Answer Key)
A $3.89 low against an $8.83 peak after Russia invaded Ukraine backs the wheat price math worked out here, next to the 0 to 10 scores rating wheat, smartphones, restaurants, and search engines on all four conditions of the model.
-
Exit Ticket (Student)
One question asks which item fails a required test for a competitive market, another asks the shape of a firm's demand curve inside that market, and a third states the long-run profit outlook once entry and exit run their course. Students test one real market against every condition.
-
Exit Ticket (Answer Key)
Government licensing is the answer that fails the competitive-market test, a horizontal line at the market price is the individual firm's demand curve, and zero is the long-run profit outlook once entry and exit run their course. Credit goes to answers naming a market checked against every test.
-
Guided Notes (Student)
A bushel of wheat swung between $3.89 and $8.83 across 2016 to 2022, and students check that market against the M-I-F-P mnemonic before comparing the market chart's $7 price to a single farm's flat demand line. A smartphone diagnosis using the same four conditions closes it out.
-
Guided Notes (Teacher Key)
Every M-I-F-P condition stands matched to wheat farming, from tens of thousands of sellers to the $7 equilibrium price, next to the smartphone and used-car failures that break conditions 1 and 4. The long-run zero economic profit explanation carries its full answer.
-
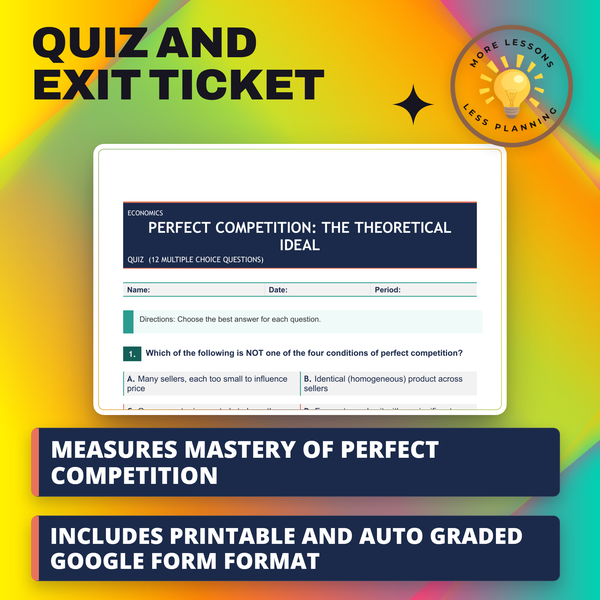
Quiz (Student)
Wheat prices on a chart send students to a 2016 low near $3.89 and a 2022 peak near $8.83, and a separate item asks which real market most often violates the perfect-information condition, and which feature sets it furthest from a monopoly.
-
Quiz (Answer Key)
U.S. wheat farming comes closest to meeting all four conditions, open entry and exit push long-run economic profit to zero, and used cars get flagged as where perfect information fails.
-
Slides
Wheat carries the whole deck, a $7 a bushel market price next to one farm's horizontal demand curve at that same $7, the signature of a price taker. A price chart running from $3.89 in 2016 up to $8.83 in 2022 makes the case before unrestricted entry and exit drive profit toward zero.
-
Teacher Guide
A 2010 to 2024 wheat price chart sets the pace for discussion, weighing Apple's profit margin against a wheat farm's before restaurants and search engines get diagnosed by the M-I-F-P mnemonic.
-
Teacher Presentation Notes
Facebook shows up as the failing case, flunking nearly all four conditions in one discussion prompt, right after Apple and Samsung's combined 50 percent of smartphone sales stands in for the opposite of many sellers. Gold purity and foreign currency round out the homogeneous examples.
Download
Where should I send the next one?
Everything here is free and it stays that way. Leave your email and I'll send you the new lessons as they go up. You can unsubscribe from any one of them.
Related resources
Big Tech Antitrust - Google Apple Amazon Meta
Cartels and Collusion - How OPEC Controls Oil
Monopolistic Competition: Brand Wars

Monopoly: One Seller, All the Power

Oligopoly - When a Few Dominate
The Ticketmaster Monopoly Investigation
Every lesson on this site is free to download and use. If one of them saved you a prep period, you can chip in a few bucks toward my three kids' daycare fund. That's genuinely where tips go.