
Oligopoly - When a Few Dominate
Quality reviewed September 2026
- Grades
- Grades 9-12
- Time
- About two 50-minute class periods
- Includes
- 11 ready-to-teach files
- Format
- Word (.docx) · PowerPoint (.pptx)
- Slide deck
- Guided notes
- Guided notes teacher key
- Activity + answer key
- Quiz + answer key
- Exit ticket + answer key
- Teacher guide
- Teacher presentation notes
What students do
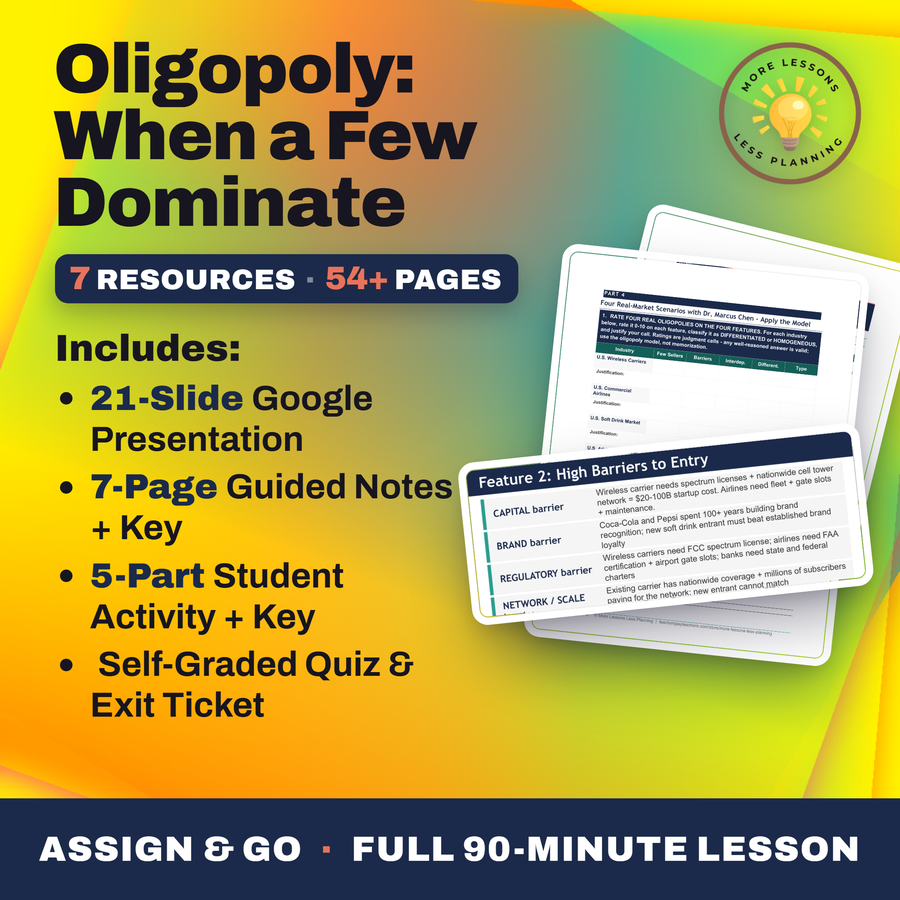
- Rate real U.S. industries on the four features of oligopoly using the four-firm concentration ratio (CR4)
- Read a prisoner's dilemma payoff matrix to find the Nash equilibrium in wireless carrier pricing
- Explain why the kinked demand curve makes oligopoly prices sticky, with rivals matching cuts but not raises
- Recommend whether the FTC should investigate the wireless carrier market in a policy memo to a fictional antitrust economist
What it covers
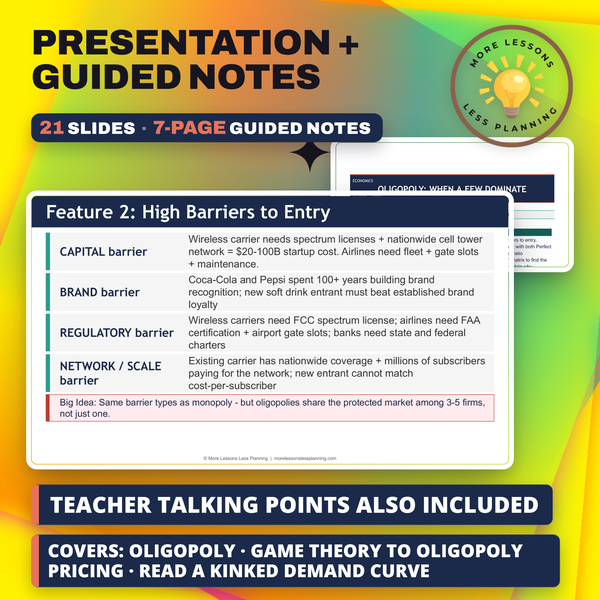
- The four defining features of oligopoly: few sellers, high barriers to entry, interdependence, and product type
- CR4 thresholds across six real industries, from wireless carriers at 96% to restaurants at 10%
- Overt collusion versus tacit collusion, and why price leadership is legally hard to prosecute
- Antitrust tools including merger review, with the 2024 DOJ challenge to the JetBlue/Spirit deal
Learning targets
- Define OLIGOPOLY using its four defining features (few sellers, high barriers to entry, interdependent firms, differentiated or homogeneous products) and contrast it with both Perfect Competition (TK 21) and Monopoly (TK 22) using the four-firm concentration ratio
- Apply game theory to oligopoly pricing - read a prisoner's dilemma payoff matrix to find the Nash equilibrium, distinguish COLLUSION from TACIT COLLUSION, and explain why interdependent firms have a structural incentive to coordinate prices
- Read a KINKED DEMAND CURVE - explain why oligopoly prices are sticky (rivals do not match raises but DO match cuts), identify real-world examples (airlines, wireless, soft drinks), and evaluate when antitrust action is appropriate
Peek inside
From PC to Monopoly
PC (TK 21): MANY sellers, identical product, free entry
Monopolistic Comp: many sellers, differentiated product
OLIGOPOLY (TK 23): FEW sellers, high barriers, interdependent
Monopoly (TK 22): ONE seller, no substitutes, total power
1. Dr. Chen asks you to name the feature that separates oligopoly from every other market structure. Each oligopoly firm must constantly watch and guess what its rivals will do, because its own profit depends on their choices - this defining feature is called .
Why this matters
Three friends on three different wireless carriers compare bills and find the prices within a couple dollars of each other, without Verizon, AT&T, and T-Mobile ever meeting in a room. The CR4 ratio explains why: those three carriers control 96 percent of the market, against 10 percent for restaurants, and that concentration moves prices together.
The prisoner's dilemma matrix earns its keep by getting students to the Nash equilibrium themselves. Seeing that raising price costs 40 units of sales while cutting it gains only 10 shows why a firm leaves price alone, and why the DOJ still challenged the 2024 JetBlue-Spirit merger without proof of an actual meeting.
From one teacher to another
Every time we cover wireless plans, a student asks why Verizon, AT&T, and T-Mobile all charge close to the same price without ever meeting in a room to fix it, and answering that question honestly is the whole point of this lesson. The prisoner's dilemma payoff matrix gets them to the Nash equilibrium themselves, and the kinked demand curve chart shows exactly why raising price loses 40 units while cutting it only gains 10, so firms just leave price alone. By the end they're rating real industries with CR4 numbers, distinguishing the collusion that lands executives in prison from the tacit kind that doesn't, and writing a policy memo to the FTC that has to cite an actual number from the charts, not just an opinion.
Every file in this toolkit
-
Activity (Student)
Dr. Marcus Chen has students rank six real industries by their four-firm concentration ratio, from wireless carriers at 96 percent down to restaurants at 10 percent. A payoff matrix then finds the Nash equilibrium behind an FTC recommendation.
-
Activity (Answer Key)
A carrier earning $30 billion for competing alone against $20 billion for cooperating explains the worked Nash equilibrium. It sits next to the CR4 rankings from 96 percent to 10 percent and the FTC's six-month action plan.
-
Exit Ticket (Student)
One question asks why the Nash equilibrium in the wireless matrix lands on both firms competing, another asks what most distinguishes oligopoly from perfect competition, and a third asks why prices stay sticky. The response points to a real oligopoly and argues whether regulators should step in.
-
Exit Ticket (Answer Key)
Interdependence is the defining oligopoly feature, gaining more from competing than cooperating regardless of the rival's move explains the Nash equilibrium, and the demand curve's kink is the source of sticky pricing. Two points ride on a named example and a clear verdict.
-
Guided Notes (Student)
A CR4 near 96 for wireless carriers and near 10 for restaurants sets the scale from competitive to near-monopoly before a payoff matrix where both firms competing earn $10 billion against $20 billion cooperating. A kinked demand chart shows units lost raising price versus units gained cutting it.
-
Guided Notes (Teacher Key)
$20 billion each for cooperating against $10 billion each for the Nash equilibrium outcome stand answered beside the kinked demand numbers, a $54 price losing 40 units and a $35 price gaining only 10. All ten market-structure terms carry their definitions for quick review.
-
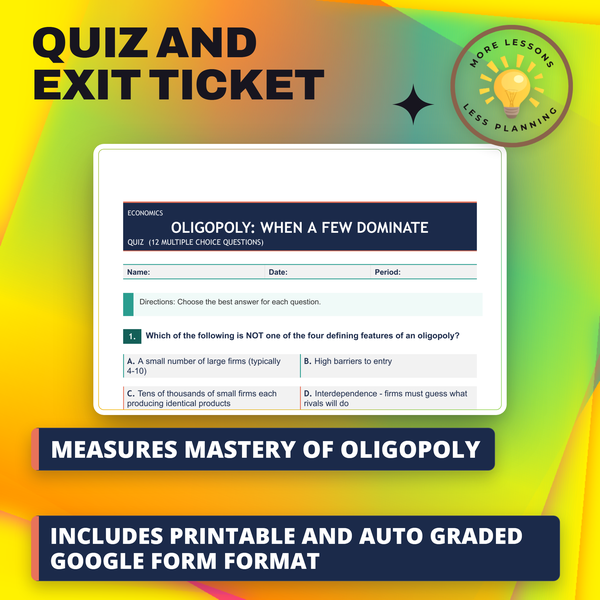
Quiz (Student)
A payoff matrix listing cooperate and compete outcomes in billions has students pin down the stable outcome among three wireless carriers charging nearly the same price, plus a CR4 item on market concentration.
-
Quiz (Answer Key)
Both carriers competing at $10 billion each turns out to be the stable outcome, wireless carriers rank highest on the CR4 chart, and OPEC gets named as a cartel that operates legally.
-
Slides
Wireless carriers post a 96% concentration ratio on one bar chart, a prisoner's dilemma matrix walks toward Nash equilibrium next, and a kinked curve shows a $50 price rising to $54 losing 40 customers while a cut to $35 gains only 10.
-
Teacher Guide
Local oligopoly audits send students rating gas stations or big-box retailers on the same four features used for wireless carriers, then estimating a rough CR4 for their own town. A later discussion compares that pattern to Big Tech's ad markets and app stores.
-
Teacher Presentation Notes
Restaurant ownership at 10 percent concentration shares a ranking card with wireless carriers at 96, both pulled from the CR4 threshold list used to test whether a market actually counts as an oligopoly.
Download
Where should I send the next one?
Everything here is free and it stays that way. Leave your email and I'll send you the new lessons as they go up. You can unsubscribe from any one of them.
Related resources
Big Tech Antitrust - Google Apple Amazon Meta
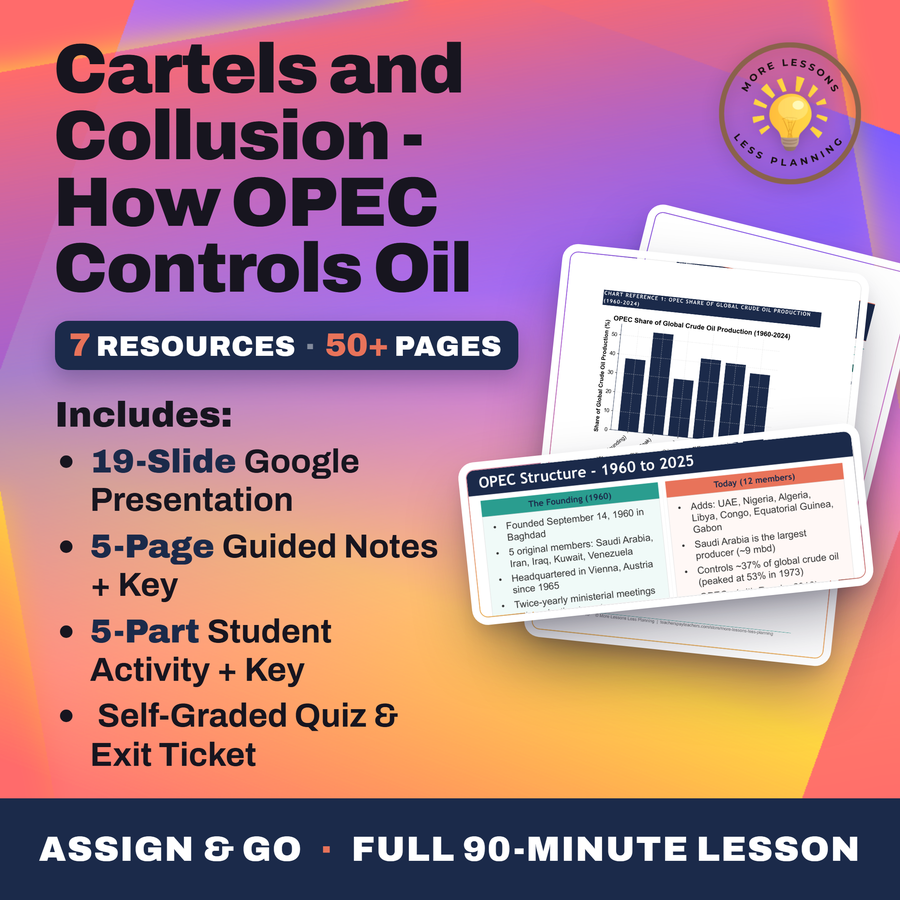
Cartels and Collusion - How OPEC Controls Oil
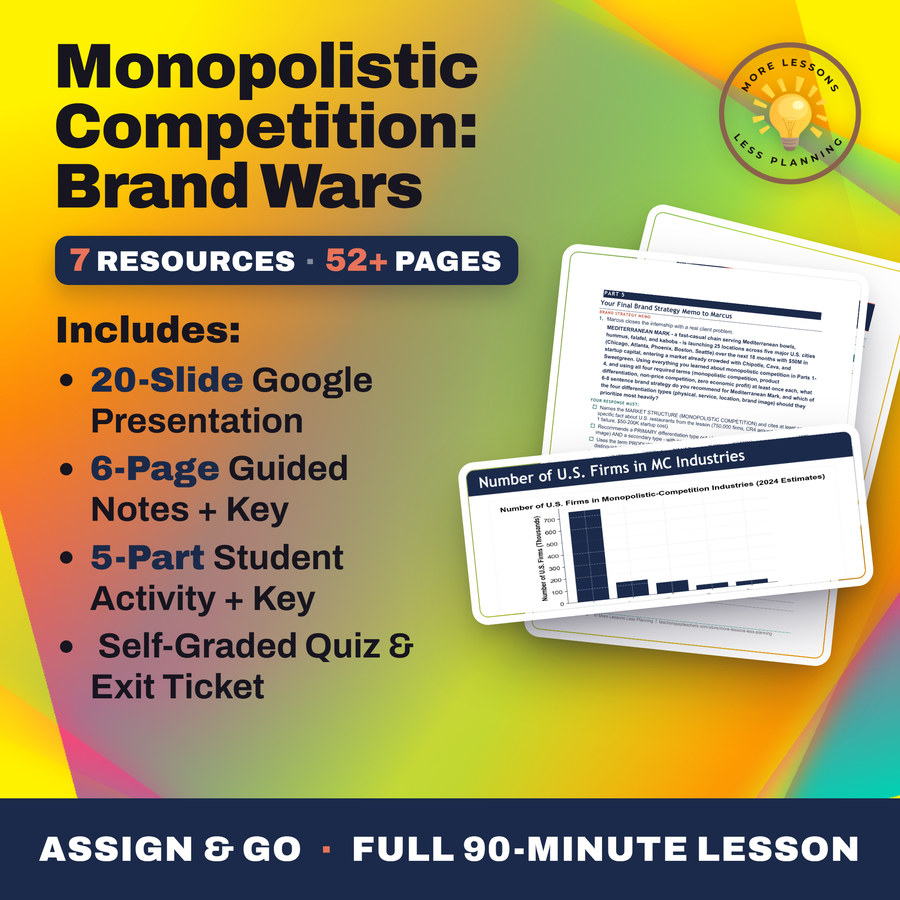
Monopolistic Competition: Brand Wars
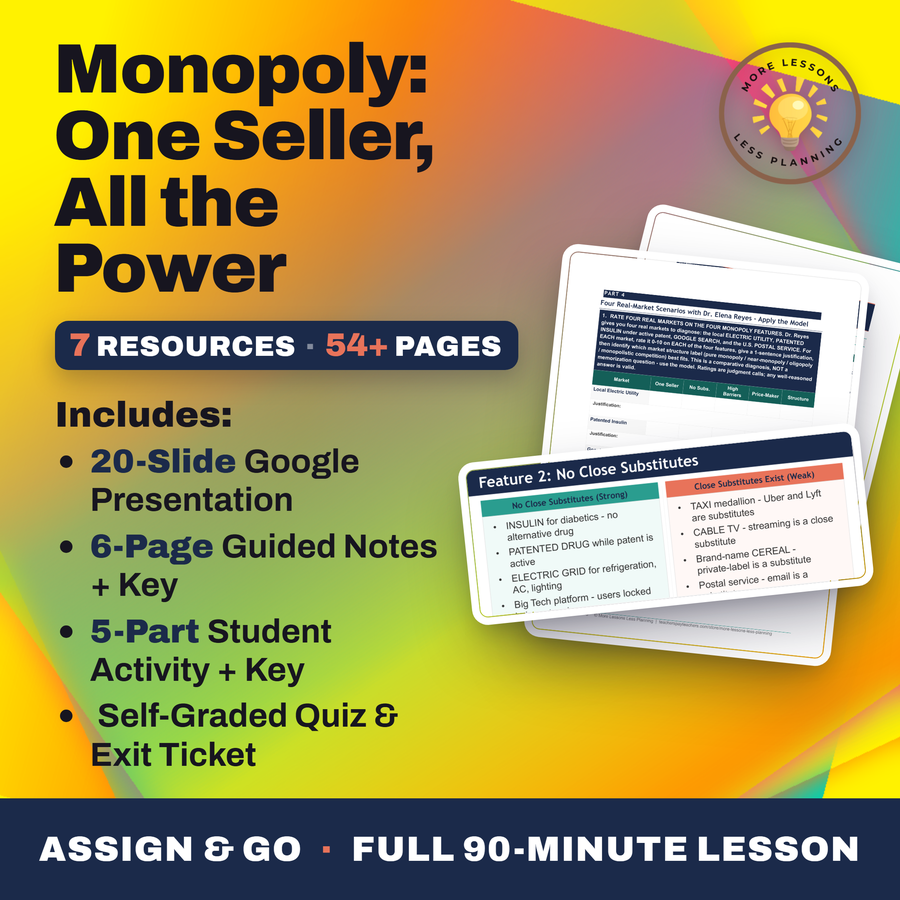
Monopoly: One Seller, All the Power
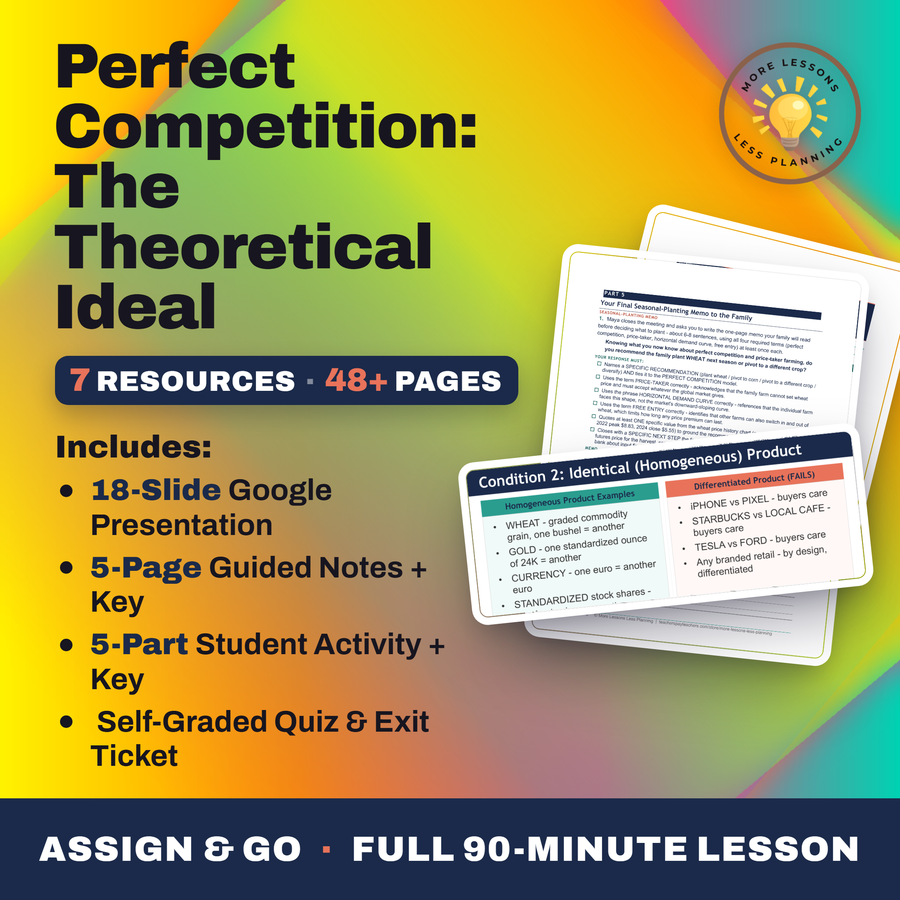
Perfect Competition: The Theoretical Ideal
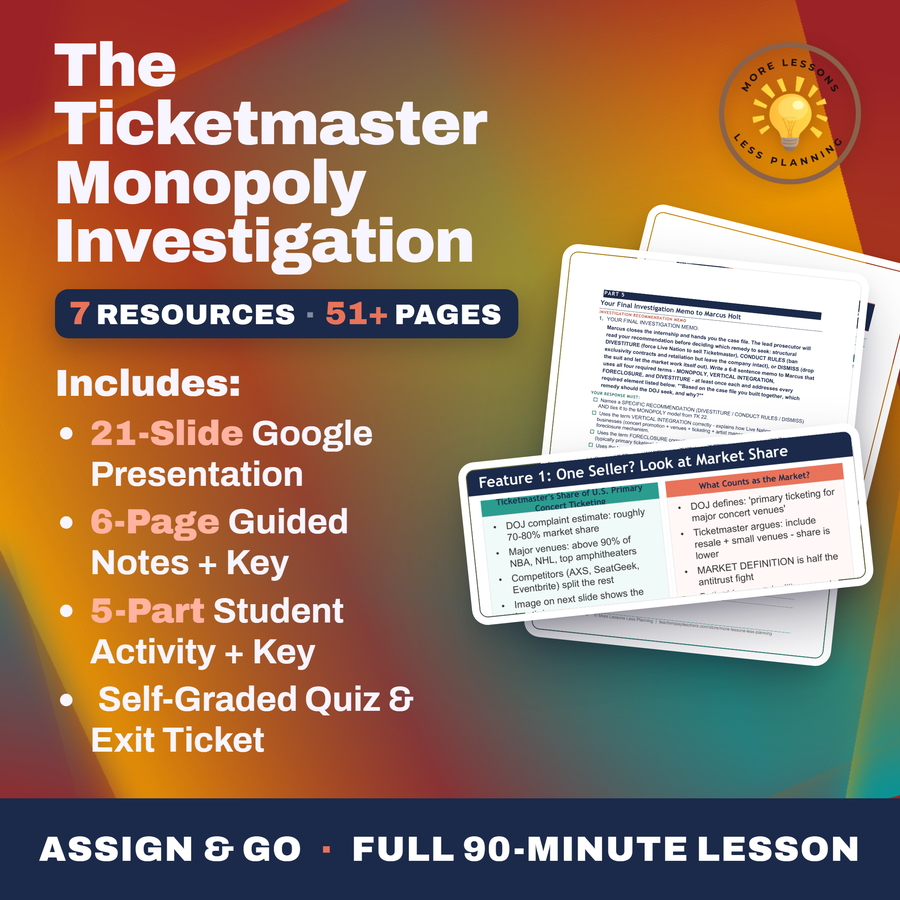
The Ticketmaster Monopoly Investigation
Every lesson on this site is free to download and use. If one of them saved you a prep period, you can chip in a few bucks toward my three kids' daycare fund. That's genuinely where tips go.