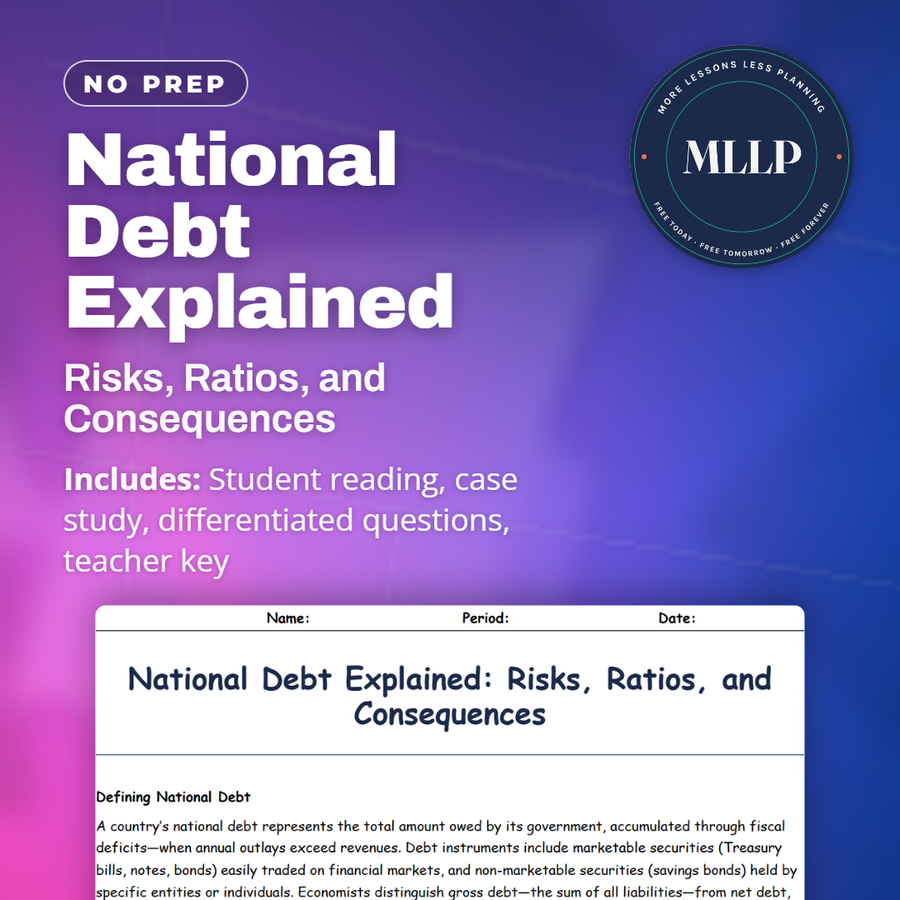
National Debt Explained: Risks, Ratios, and Consequences
Quality reviewed September 2026
Facts verified September 8, 2026
- Grades
- Grades 9-12
- Length
- 6-page student worksheet
- Time
- About one 50-minute class period
- Great for
- Sub plans and independent work
- Includes
- Reading passage, comprehension questions + full answer key
- Format
- Print-and-go PDF
What students do
- Calculate and interpret debt-to-GDP ratios using numerical examples from the passages
- Analyze Country W's debt crisis and recovery to identify which policy combinations restored fiscal sustainability
- Match debt-related terms like "net debt," "debt-to-GDP ratio," "marketable securities," and "crowding out" to their definitions
- Explain how high interest-payment burdens reduce fiscal space and constrain public investment
What it covers
- Defining national debt and understanding the debt-to-GDP ratio as a gauge of fiscal sustainability
- Interest payment burdens, fiscal space, and how debt servicing can crowd out productive government investments
- Long-term risks including intergenerational equity concerns and strategies for restoring debt sustainability
Start reading this worksheet
Defining National Debt
A country’s national debt represents the total amount owed by its government, accumulated through fiscal deficits (when annual outlays exceed revenues). Debt instruments include marketable securities (Treasury bills, notes, bonds) easily traded on financial markets, and non-marketable securities (savings bonds) held by specific entities or individuals. Economists distinguish gross debt (the sum of all liabilities) from net debt, which subtracts government financial assets. Understanding these definitions clarifies discussions of debt sustainability and policy trade-offs.
Debt-to-GDP Ratio as a Sustainability Gauge
The debt-to-GDP ratio measures debt relative to the size of the economy: debt-to-GDP = total debt / GDP A rising ratio signals that debt grows faster than output, potentially jeopardizing fiscal health. Governments target stable or declining ratios to reassure investors and maintain low borrowing costs. For example, a debt of 20 trillion dollars against a 25 trillion dollar GDP yields a ratio of 0.8 (80 percent). If GDP grows at 3 percent annually while debt rises by 2 percent, the ratio gradually falls. This illustrates the role of growth in debt dynamics.
Interest-Payment Burdens and Fiscal Space
As debt mounts, so do interest payments, which consume a growing share of annual budgets. High interest burdens reduce fiscal space (the capacity to finance new initiatives or respond to crises). When interest rates on debt exceed GDP growth rates, debt servicing can spiral, forcing cuts to productive investments or hikes in taxes. Policymakers monitor primary deficits (excluding interest) and net interest outlays to assess long-term solvency.
Like what you read? The full reading, the case study, and every question set are in the free download below, along with the answer key.
Why this matters
Does a bigger national debt automatically mean a country is worse off? Debt-to-GDP is what predicts risk, not the raw number, and Country W's recovery through primary surpluses paired with growth proves a heavy debt load can be worked down without one crushing austerity move.
I ask students why Country W's primary surpluses paired with growth actually worked, since that recovery makes intergenerational equity real: today's deficit becomes tomorrow's interest payment, paid by people who had no vote in creating it. Interest crowding out infrastructure spending turns debt ceilings into a question of whose priorities get funded.
From one teacher to another
I use this reading to help students understand why national debt matters to their financial future. My students learn what debt-to-GDP ratios tell us about fiscal health and why the ratio matters more than debt in absolute dollars. The Country W case study shows how a nation that saw debt surge during a financial crisis managed to recover by combining primary surpluses with growth. They explore crowding out and intergenerational equity, recognizing that today's deficits impose burdens on future taxpayers. Understanding these dynamics helps them see why policymakers debate debt ceilings and why interest payments eventually constrain an entire government's ability to invest in infrastructure and services.
What you get
- Answer Key
-
Student Worksheet
Country W entered the 2008 crisis with a debt-to-GDP ratio of just 40 percent, but bailouts and stimulus pushed it to 90 percent by 2012 and yields on its bonds climbed above 6 percent after rating downgrades. A 1 percent of GDP primary surplus target, a broad consumption tax that raised 1.5 percent of GDP in new revenue, and 4 percent annual growth brought the ratio back under 80 percent by 2020 and yields down to about 2 percent.
Download
Where should I send the next one?
Everything here is free and it stays that way. Leave your email and I'll send you the new lessons as they go up. You can unsubscribe from any one of them.
Related resources
Budget Deficits & Surpluses: Understanding Fiscal Balances
Federal Budget & Debt: Funding the Nation’s Priorities
Fiscal Policy Impact: Fueling or Hindering Economic Growth

Fiscal Policy Tools: Expansionary and Contractionary Tactics

Major Tax Categories

Market Failures: Why Markets Don’t Always Work
Every lesson on this site is free to download and use. If one of them saved you a prep period, you can chip in a few bucks toward my three kids' daycare fund. That's genuinely where tips go.