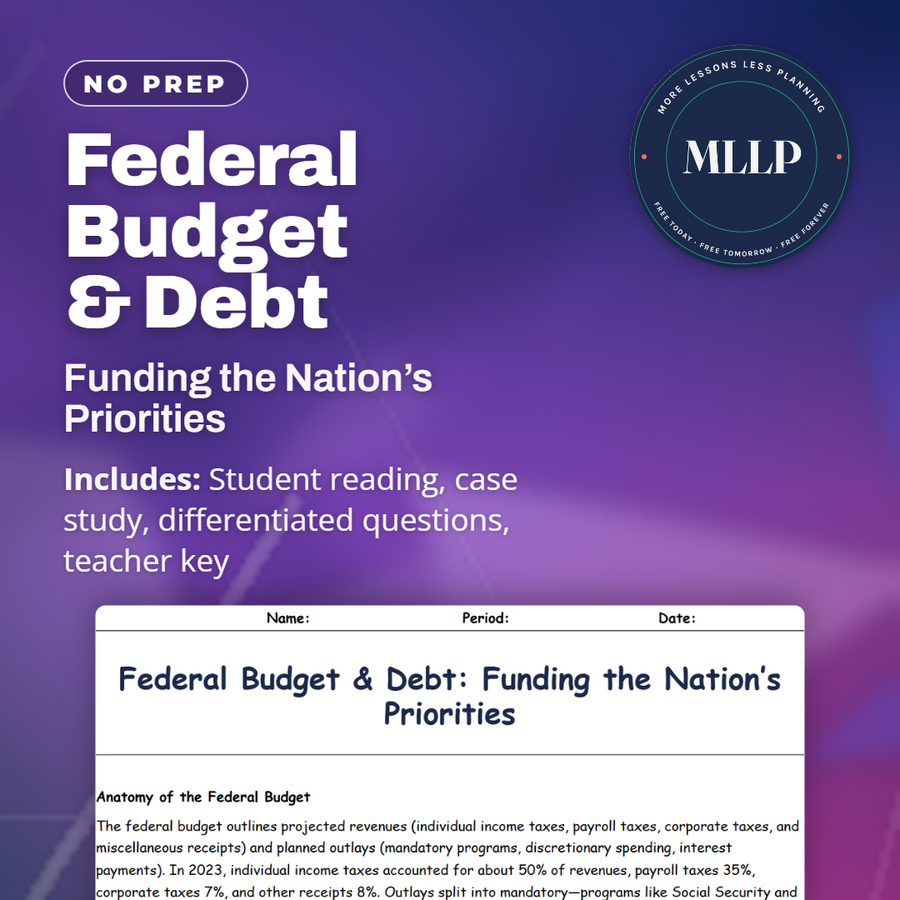
Federal Budget & Debt: Funding the Nation’s Priorities
Quality reviewed September 2026
Facts verified September 8, 2026
- Grades
- Grades 9-12
- Length
- 6-page student worksheet
- Time
- About one 50-minute class period
- Great for
- Sub plans and independent work
- Includes
- Reading passage, comprehension questions + full answer key
- Format
- Print-and-go PDF
What students do
- Analyze 2023 federal revenue sources (50% individual income tax, 35% payroll tax, 7% corporate, 8% other) and outlay categories
- Compare budget deficits (annual imbalance) with national debt (cumulative total) and calculate debt-to-GDP sustainability ratio
- Examine the 2011 debt-ceiling crisis where political brinkmanship triggered Standard & Poor's downgrade and market turmoil
- Answer questions about mandatory spending (Social Security, Medicare) versus discretionary appropriations and why deficits affect borrowing costs
What it covers
- Federal budget structure including mandatory and discretionary spending categories
- Debt-to-GDP ratio as a sustainability measure and why Japan's 250% ratio differs from risks at lower levels
- Economic consequences of rising debt including crowding out of private investment and fiscal constraints on policy
Start reading this worksheet
Anatomy of the Federal Budget
The federal budget outlines projected revenues (individual income taxes, payroll taxes, corporate taxes, and miscellaneous receipts) and planned outlays (mandatory programs, discretionary spending, interest payments). In 2023, individual income taxes accounted for about 50% of revenues, payroll taxes 35%, corporate taxes 7%, and other receipts 8%. Outlays split into two types: mandatory programs, like Social Security and Medicare, which adjust automatically with eligibility, and discretionary spending, which Congress approves annually (defense, education, infrastructure). Interest on the national debt is also a separate outlay category. The process begins with the President’s budget proposal, moves through congressional committees, and culminates in appropriation bills by September 30 each year.
Deficits vs. Debt: Key Distinctions
A budget deficit occurs when annual outlays exceed revenues. The national debt is the cumulative total of all past deficits minus surpluses. That total works much like a household’s mortgage balance. Running short‐term deficits can stimulate economic activity in downturns, but persistent deficits raise the debt‐to‐GDP ratio, potentially heightening borrowing costs. Distinguishing flow (deficit) from stock (debt) is crucial: a manageable deficit at low debt levels poses fewer risks than the same deficit when debt is already high.
Measuring Sustainability: Debt-to-GDP Ratio
The debt-to-GDP ratio gauges public debt relative to the economy’s size: Debt-to-GDP = (Total Public Debt ÷ Nominal GDP) × 100%. A moderate ratio suggests debt is serviceable; a high ratio can alarm investors and lead to credit‐rating downgrades. Japan’s ratio exceeds 250%, yet low interest rates have kept financing costs modest. The U.S. ratio rose above 130% post-pandemic, prompting debates on sustainability. Policymakers use this metric to decide whether to pursue spending cuts, tax hikes, or rely on growth to stabilize the ratio.
Like what you read? The full reading, the case study, and every question set are in the free download below, along with the answer key.
Why this matters
Income taxes fund about half of federal revenue, and Social Security and Medicare together account for more than half of spending. The largest categories aren't yearly choices Congress debates: they're commitments already locked in, and interest alone now consumes 9 percent.
Congress delayed raising the debt ceiling in 2011 as a political move, and Standard and Poor's downgraded U.S. debt from AAA to AA plus. Treasury yields moved because investors suddenly priced in default risk, which makes a debt-to-GDP ratio feel like a real constraint.
From one teacher to another
I use this reading to ground students in how government finances actually work, starting with the revenue and spending breakdown. The worksheet walks through how individual income taxes fund about half of federal receipts, then examines spending: Social Security takes 24%, Medicare and Medicaid 28%, defense 13%, and interest on debt now consumes 9% of outlays. Students confront the 2011 debt-ceiling crisis where Congress delayed raising the borrowing limit, causing Standard & Poor's to downgrade U.S. debt from AAA to AA+. The reading explains why this matters: when investors fear default, Treasury yields spike, making government borrowing more expensive. Students fill in blanks about deficits versus debt, match sequestration and budget surplus to definitions, and write short answers on why the debt-to-GDP ratio beats absolute debt size for judging whether a country can sustain its obligations.
What you get
- Answer Key
-
Student Worksheet
Japan's debt-to-GDP ratio tops 250 percent, and low rates keep its financing manageable even as the U.S. ratio climbed above 130 percent since the pandemic. Stock indices fell more than 16 percent in the two weeks after the 2011 credit downgrade warning, and the Budget Control Act that followed raised the ceiling by $2.1 trillion while locking in $917 billion of future cuts through sequestration.
Download
Where should I send the next one?
Everything here is free and it stays that way. Leave your email and I'll send you the new lessons as they go up. You can unsubscribe from any one of them.
Related resources
Budget Deficits & Surpluses: Understanding Fiscal Balances
Fiscal Policy Impact: Fueling or Hindering Economic Growth
Fiscal Policy Tools: Expansionary and Contractionary Tactics
Major Tax Categories

Market Failures: Why Markets Don’t Always Work
National Debt Explained: Risks, Ratios, and Consequences
Every lesson on this site is free to download and use. If one of them saved you a prep period, you can chip in a few bucks toward my three kids' daycare fund. That's genuinely where tips go.