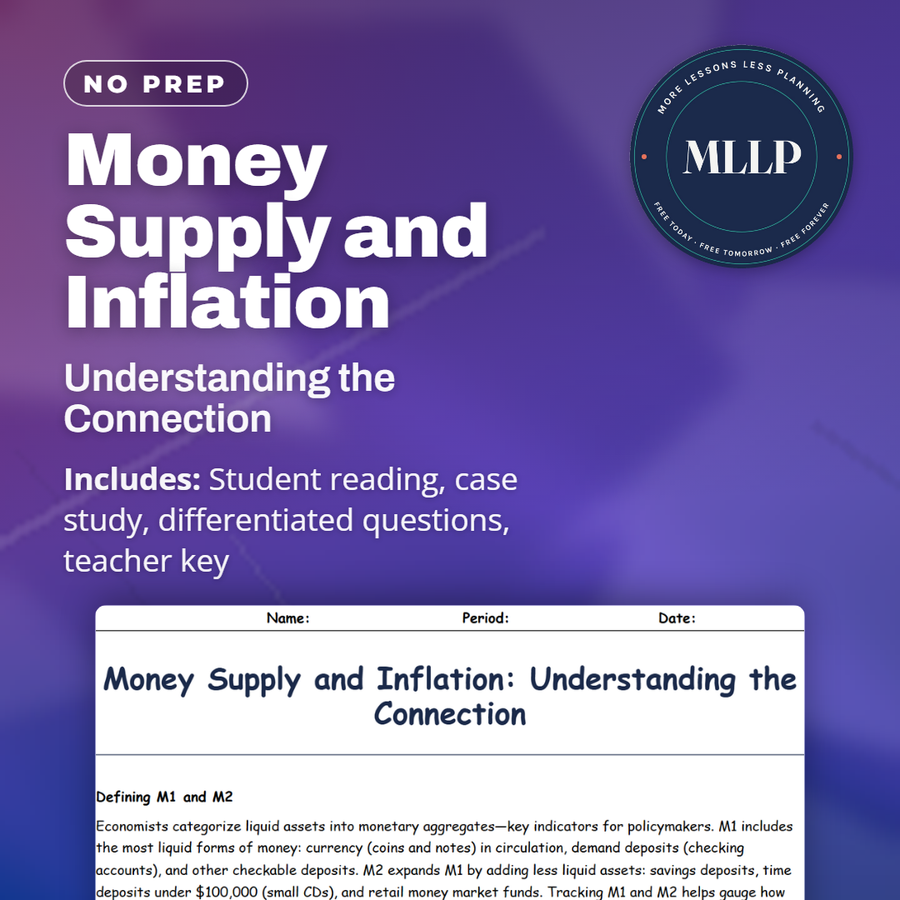
Money Supply and Inflation: Understanding the Connection
Quality reviewed September 2026
Facts verified September 8, 2026
- Grades
- Grades 9-12
- Length
- 6-page student worksheet
- Time
- About one 50-minute class period
- Great for
- Sub plans and independent work
- Includes
- Reading passage, comprehension questions + full answer key
- Format
- Print-and-go PDF
What students do
- Compare M1 and M2 monetary aggregates and explain why central banks track both to gauge spending power and credit conditions
- Distinguish demand-pull inflation from cost-push inflation and analyze how money supply growth can exacerbate demand-pull pressures
- Examine Zimbabwe's 2007-2008 hyperinflation crisis: how deficit spending triggered 79.6 billion percent annual inflation and forced dollarization
- Evaluate interest rate hikes and other policy tools central banks use to temper inflation and anchor public expectations about future prices
What it covers
- Monetary aggregates (M1, M2) and what they tell us about liquidity, spending power, and early warning signs of inflationary pressure
- The mechanics of inflation: demand-pull versus cost-push; role of expectations in self-fulfilling price spirals; velocity and credit conditions
- Hyperinflation and policy responses: Zimbabwe's collapse from unchecked money creation, the dangers of losing store-of-value function, and how dollarization restored stability
Start reading this worksheet
Defining M1 and M2
Economists categorize liquid assets into monetary aggregates, which are key indicators for policymakers. M1 includes the most liquid forms of money: currency (coins and notes) in circulation, demand deposits (checking accounts), and other checkable deposits. M2 expands M1 by adding less liquid assets: savings deposits, time deposits under $100,000 (small CDs), and retail money market funds. Tracking M1 and M2 helps gauge how much spending power exists in the economy. Rapid growth in these aggregates can presage increased consumer spending, while stagnation may signal tightening credit conditions. Understanding these distinctions is critical: not all “money” moves at the same speed or reacts equally to policy changes.
Money Supply Growth and Price Levels
When the money supply expands faster than the economy’s capacity to produce goods and services, excess liquidity chases limited output, driving prices upward. Central banks monitor money growth as an early warning of inflationary pressures. In the 1970s, for example, sustained increases in M2 fueled double-digit inflation in many advanced economies. Conversely, sluggish money growth, especially of the narrow M1, can precede economic slowdowns, as businesses and consumers find it harder to borrow and spend. However, the relationship between money aggregates and inflation is not mechanical; velocity (the speed at which money circulates) and broader credit conditions also matter.
The Mechanics of Inflation
Inflation occurs when the general price level rises over time. Economists distinguish demand-pull inflation, where aggregate demand outstrips supply, from cost-push inflation, triggered by higher input costs (wages, commodities). A growing money supply can exacerbate demand-pull pressures if consumers and firms hold higher balances and spend more. Expectations play a critical role: if people anticipate future inflation, they accelerate purchases and wage demands, creating a self-fulfilling cycle. Central banks combat this by tightening policy, such as raising interest rates or curbing reserve growth, to temper demand and anchor expectations.
Like what you read? The full reading, the case study, and every question set are in the free download below, along with the answer key.
Why this matters
Inflation sounds like a slow drift in prices until you see Zimbabwe's 2008 collapse, where paychecks lost real value between the morning shift and the drive home. Unchecked money creation chasing a fixed supply of goods is the demand-pull mechanism behind that collapse.
Students confuse M1 and M2 until they explain why a central bank tracks both. I have them work out why 79.6 billion percent annual inflation forced Zimbabwe to dollarize instead of just printing more carefully. That number explains monetary restraint better than any definition.
From one teacher to another
I use this reading when students need to understand inflation as more than just "prices go up." The worksheet connects monetary aggregates to real consequences: rapid M2 growth in the 1970s fueled double-digit inflation, while today's tracking of M1 helps the Fed anticipate demand shocks. The Zimbabwe case study is stark and memorable. By November 2008, prices changed hour to hour, salaries were worthless by lunch, and the government abandoned the currency entirely. Students see why central banks guard against uncontrolled money creation and why credible, transparent inflation targets are part of modern monetary management. The reading grounds abstract monetary theory in lived economic collapse and recovery.
What you get
- Answer Key
-
Student Worksheet
Economists define hyperinflation as a monthly rate above 50 percent, a threshold the Weimar Republic crossed in 1923 long before Zimbabwe repeated the pattern decades later. Once prices spiral that fast, households rush to spend cash before it loses value, businesses index wages hourly, and barter or foreign currency often replaces money, which is why central banks lean on interest rate hikes well before things reach that point.
Download
Where should I send the next one?
Everything here is free and it stays that way. Leave your email and I'll send you the new lessons as they go up. You can unsubscribe from any one of them.
Related resources
Monetary Policy: How the Fed Controls the Economy
The Federal Reserve: America’s Central Bank Explained

Amazon Warehouses: Working Conditions Investigation

Anti-Trust Laws and Regulation: Promoting Fair Competition

Barriers to Entry: What Keeps Competitors Out

Big Tech Antitrust - Google Apple Amazon Meta
Every lesson on this site is free to download and use. If one of them saved you a prep period, you can chip in a few bucks toward my three kids' daycare fund. That's genuinely where tips go.