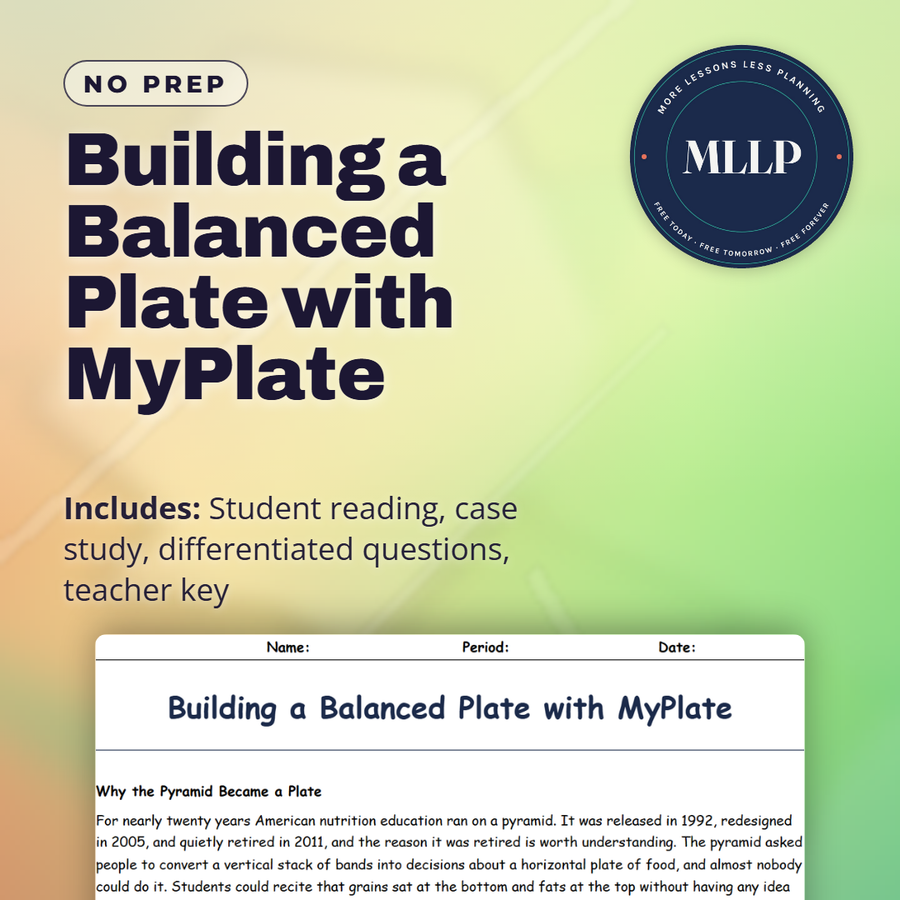
Building a Balanced Plate with MyPlate
Quality reviewed September 2026
Facts verified September 23, 2026
- Subject
- Career & Life Skills
- Grades
- Grades 9-12
- Length
- 9-page student worksheet
- Time
- About one 50-minute class period
- Great for
- Sub plans and independent work
- Includes
- Reading passage, comprehension questions + full answer key
- Format
- Print-and-go PDF
What students do
- Why MyPlate counts beans and lentils in two different food groups gets explained from the reading
- Match five MyPlate terms, from whole grain to the added sugars limit, to their definitions
- Marcus's lunch tray gets audited against the plate proportions he was missing
- Fill in three blanks on the pyramid's replacement, teen calcium, and the sodium limit
What it covers
- Why the food pyramid gave way to a single plate graphic in 2011
- The five food groups and what each subgroup of vegetables supplies
- Marcus's case study and the ratio he changed on his lunch tray
Start reading this worksheet
Why the Pyramid Became a Plate
For nearly twenty years American nutrition education ran on a pyramid. It was released in 1992, redesigned in 2005, and quietly retired in 2011, and the reason it was retired is worth understanding. The pyramid asked people to convert a vertical stack of bands into decisions about a horizontal plate of food, and almost nobody could do it. Students could recite that grains sat at the bottom and fats at the top without having any idea what that meant for the tray in front of them. The replacement, MyPlate, was released by the United States Department of Agriculture in 2011 and solved that problem by simply drawing the plate. MyPlate was the federal government's main food guidance graphic from 2011 until January 2026, when the 2025-2030 Dietary Guidelines for Americans replaced it with an inverted pyramid graphic. This reading covers the MyPlate model and the proportion lesson behind it. MyPlate is a place setting divided into four sections, fruits, vegetables, grains, and protein foods, with a circle beside it for dairy. That is the entire model. It contains no numbers, no serving counts, and no calorie targets, which critics initially treated as a weakness and which turned out to be its main strength. A person standing at a buffet line or a cafeteria window can compare what is on their tray to a picture in about two seconds. MyPlate is a proportion tool. It answers the question of how much of the plate each kind of food should occupy, not how many calories a person should eat. Those are genuinely different questions, and the older models kept tangling them together. The recommendation underneath the picture is short enough to memorize. Make half the plate fruits and vegetables, with vegetables the larger of the two. Make at least half the grains whole grains. Vary the protein routine. Move toward low-fat or fat-free dairy, or fortified soy alternatives.
Vegetables and Fruits: Half the Plate, and Not Interchangeable
Half the plate going to fruits and vegetables is the single instruction most Americans miss, and by a wide margin. National intake data have shown for years that the large majority of adults and children fall short of recommended amounts for both groups. The two are grouped together in the picture, but they are not identical in what they deliver. Vegetables generally carry fewer calories and less sugar per cup and are meant to be the larger portion of the two. MyPlate divides vegetables into five subgroups precisely because eating a cup of iceberg lettuce every day is not the same as eating across the category. Dark green vegetables such as spinach, kale, and broccoli supply vitamin K, folate, and vitamin A. Red and orange vegetables such as carrots, sweet potatoes, tomatoes, and peppers are the major sources of beta carotene and vitamin C. Beans, peas, and lentils count in this group and in the protein group at the same time, which is unusual and reflects that they deliver both fiber and protein. Starchy vegetables such as corn, potatoes, and green peas provide potassium and energy. The fifth subgroup collects everything else, including onions, mushrooms, green beans, and cucumbers. Fruit brings vitamin C, potassium, and fiber, along with natural sugar, which is not the same nutritional problem as added sugar because it arrives packaged with fiber and water. Whole fruit is preferred over juice for exactly that reason. One important and often overlooked detail is that frozen and canned produce count fully. Frozen vegetables are picked and frozen at peak ripeness and are frequently more nutritious than fresh produce that has traveled for a week, and they cost less.
Grains and Protein: Where the Word Whole Earns Its Keep
A whole grain contains all three parts of the original kernel: the bran, which is the fiber-rich outer layer, the germ, which holds most of the vitamins and healthy fat, and the endosperm, which is the starchy center. Refining a grain strips off the bran and the germ and keeps the endosperm, which is why white flour is soft, shelf-stable, and stripped of most of its fiber. Enrichment adds back several B vitamins and iron by law, which is a real public health achievement, but enrichment does not add back fiber and it does not restore the germ. That is the entire argument for the instruction to make at least half of grains whole. Reading the package is required here, because the front of a box is not evidence. Terms like multigrain, stone ground, and made with whole grains can appear on products that are mostly refined flour. The test is the ingredient list, where a whole grain should appear first, and words like whole wheat flour, brown rice, oats, and quinoa are the ones that count. Protein foods are the group MyPlate deliberately widened. The category includes meat, poultry, eggs, and seafood, and also beans, peas, lentils, nuts, seeds, and soy products. The instruction to vary the protein routine exists because a person eating only ground beef and chicken breast misses what other sources deliver. Seafood, recommended at roughly eight ounces per week for adults, supplies omega-3 fats found almost nowhere else. Nuts and seeds bring vitamin E and magnesium. Beans bring fiber, which meat contains none of at all.
Like what you read? The full reading, the case study, and every question set are in the free download below, along with the answer key.
Why this matters
A cafeteria tray is where most teenagers actually practice nutrition, whether they think about it that way or not. Marcus's case study works because the fix was not a new food, it was a different ratio on the same tray, and that is a decision a student can make at lunch today. Reading the plate as a proportion instead of a checklist is also useful past a cafeteria line, since a burrito or a bowl of soup can be judged by the same fractions once someone knows to look for them.
From one teacher to another
The USDA's MyPlate graphic guided the reading I use for this one, and it is worth being precise about what it is. It is the food guidance model the USDA used from 2011 to 2026, a place setting split into fruits, vegetables, grains, and protein foods with a circle for dairy. The worksheet walks through why it replaced the food pyramid, what each of the five vegetable subgroups supplies, and why fruit and vegetables are grouped together but not interchangeable. Students also read the five MyPlate rules, from making half the grains whole to the teen calcium target, and finish with Marcus auditing his own cafeteria tray. The reading names the guidelines that came after MyPlate without arguing for either one.
What you get
Download
Where should I send the next one?
Everything here is free and it stays that way. Leave your email and I'll send you the new lessons as they go up. You can unsubscribe from any one of them.
Related resources
Carbs, Protein, and Fat in the Kitchen
Decoding the Nutrition Facts Label
Food Allergies and Intolerances
Food Marketing and Nutrition Misinformation
Nutrition Across the Lifespan
Planning a Week of Meals
Every lesson on this site is free to download and use. If one of them saved you a prep period, you can chip in a few bucks toward my three kids' daycare fund. That's genuinely where tips go.