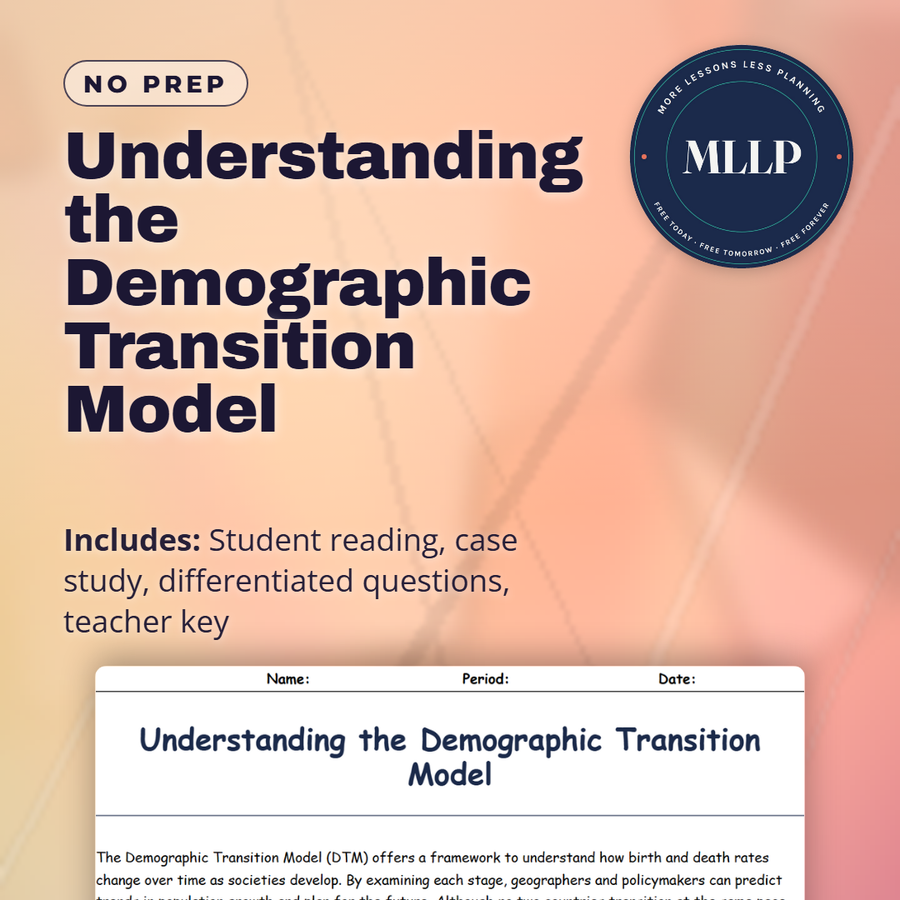
Understanding the Demographic Transition Model
Quality reviewed September 2026
Facts verified September 14, 2026
- Subject
- Social Studies
- Grades
- Grades 9-12
- Length
- 6-page student worksheet
- Time
- About one 50-minute class period
- Great for
- Sub plans and independent work
- Includes
- Reading passage, comprehension questions + full answer key
- Format
- Print-and-go PDF
What students do
- Match terms like Stage 1, Stage 4, and Aging Society to their correct definitions
- Fill in the blank sentences on food supply, aging populations, and birth rate
- Answer multiple choice questions on why population grows rapidly in Stage 2, what causes falling birth rates in Stage 3, and the central concept behind the Demographic Transition Model
- Write short answers on why birth rates stay high in Stage 2 even as death rates fall, what pushes a country from Stage 3 into Stage 4, and how the model helps governments plan ahead
What it covers
- The five stages of the Demographic Transition Model and how birth and death rates shift in each one
- Specific country examples at different stages, from Niger to Germany and Japan
- A case study on South Korea's rapid movement through the stages since the 1960s
Start reading this worksheet
The Demographic Transition Model (DTM) offers a framework to understand how birth and death rates change over time as societies develop. By examining each stage, geographers and policymakers can predict trends in population growth and plan for the future. Although no two countries transition at the same pace, the DTM remains a valuable tool for grasping the link between economic development, healthcare, and cultural shifts.
Overview of the 5 Stages of the DTM
Stage 1 features high birth and death rates, leading to slow population growth. In early human history or in certain pre-industrial societies, disease, poor nutrition, and limited medical knowledge keep the death rate high. Family sizes tend to be large to offset high infant mortality. Stage 2 sees falling death rates as healthcare, sanitation, and food supply improve, while birth rates remain high. The population grows quickly, characteristic of many developing countries entering modern industrial or agricultural improvements. Stage 3 brings declining birth rates as societies become more urban and industrial. Families choose to have fewer children due to education, employment opportunities for women, and access to contraception. Stage 4 arrives when both birth and death rates are low, stabilizing population growth. Many developed countries fit into Stage 4, with stable economies and widespread healthcare. Stage 5, a more recent addition, suggests that some highly developed societies experience birth rates so low that total population may decline over time.
Birth and Death Rates Across Stages
Each DTM stage reflects a specific relationship between births and deaths. In stages with high birth rates, large families are often culturally valued, possibly seen as an asset for agricultural labor. As economies grow and people move into cities, the cost of raising children rises. Families begin having fewer children, and the birth rate declines. Death rates drop dramatically when societies improve hygiene and medical treatment. Advances such as vaccines and antibiotics help reduce childhood mortality. Over time, better education and a focus on healthy living keep death rates low in developed countries. However, aging populations in later stages present different healthcare and social challenges.
Like what you read? The full reading, the case study, and every question set are in the free download below, along with the answer key.
Why this matters
A country can move from a rural society where large families are the norm to one where birth rates are extremely low. South Korea made that shift fast, moving from a high-birth-rate country in the 1960s to one now managing an aging population. The Demographic Transition Model tracks that shift across five stages, Stage 1 to Stage 5.
Birth rates falling the moment death rates do is the assumption most students bring in, which is why Stage 2, rapid growth because birth rates stay high even as death rates drop, catches them off guard. Tracing South Korea's path since the 1960s helps them see why governments use this model to plan schools, healthcare, and pensions years ahead.
From one teacher to another
This reading walks students through all five stages of the Demographic Transition Model, from high birth and death rates in Stage 1 to the possible population decline of Stage 5. I like that the case study on South Korea shows the model in motion, moving from a rural, high-birth-rate society in the 1960s to a country now dealing with extremely low birth rates and an aging population. Students match each stage to its definition, fill in blanks about food supply and aging, and then answer questions about why countries move between stages and how governments use the model to plan for schools, healthcare, and pensions. This pairs well with a unit on population trends.
What you get
Download
Where should I send the next one?
Everything here is free and it stays that way. Leave your email and I'll send you the new lessons as they go up. You can unsubscribe from any one of them.
Related resources
Birth Rates, Death Rates, and Life Expectancy Explained
Global Population Growth: Trends and Impacts
How Governments Shape Population Policies
Immigration vs. Emigration: What’s the Difference?
Mapping Population Density and Distribution Patterns
Overpopulation and Earth’s Carrying Capacity
Every lesson on this site is free to download and use. If one of them saved you a prep period, you can chip in a few bucks toward my three kids' daycare fund. That's genuinely where tips go.