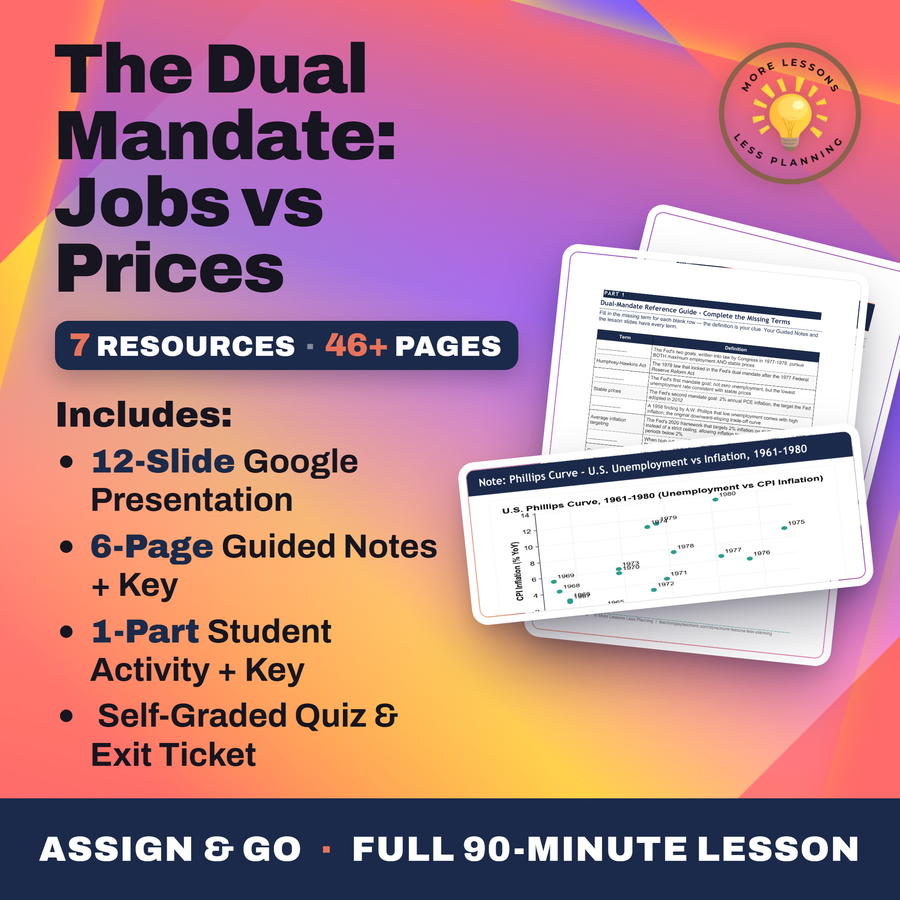
The Dual Mandate: Jobs vs Prices
Quality reviewed September 2026
- Grades
- Grades 9-12
- Time
- About two 50-minute class periods
- Includes
- 10 ready-to-teach files
- Format
- Word (.docx) · PowerPoint (.pptx)
- Slide deck
- Guided notes
- Guided notes teacher key
- Activity + answer key
- Quiz + answer key
- Exit ticket + answer key
- Teacher guide
What students do
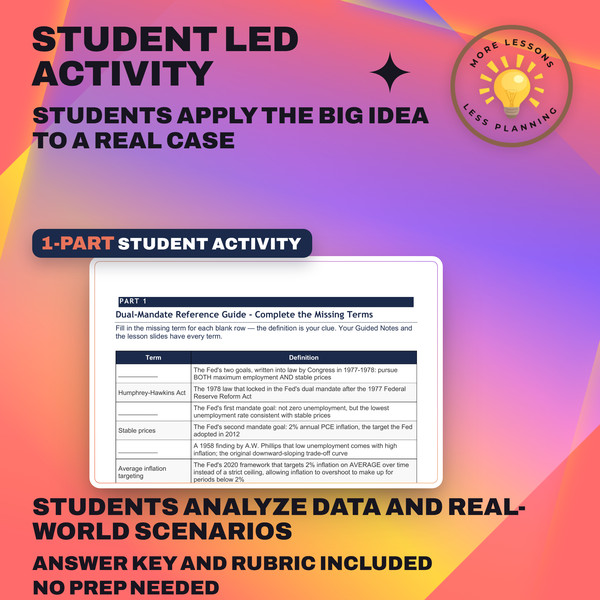
- Sort ten vocabulary terms into a Dual-Mandate Reference Guide, from Phillips curve to natural rate
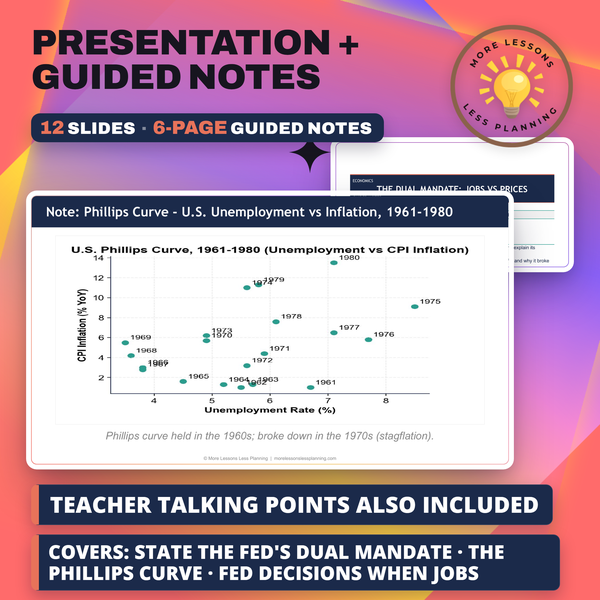
- Read a 1961-1980 Phillips curve scatter and name the year-pair where the trade-off broke down into stagflation
- Read a 2015-2026 unemployment-vs-inflation scatter and locate the 2022 outlier against the calm 2015-2019 cluster
- Write a 7-9 sentence FOMC pre-meeting memo as Dana Reyes, recommending hike, hold, or split and citing chart values
What it covers
- The dual mandate itself, set by the 1977 Federal Reserve Reform Act and locked in by the 1978 Humphrey-Hawkins Act
- The Phillips curve's 1958 trade-off and how 1970s stagflation broke it, using specific years like 1980 at 7% unemployment and 13.5% inflation
- The 2022 hike cycle, from 9.1% June CPI to eleven rate hikes in sixteen months, with Powell citing Volcker as his model
- Average inflation targeting, adopted in August 2020, and how it changed the Fed's tolerance for overshooting 2%
Learning targets
- State the Fed's dual mandate (maximum employment + stable prices) and explain its statutory origin
- Explain the Phillips curve - the short-run inflation/unemployment trade-off - and why it broke down in the 1970s
- Evaluate Fed decisions when jobs and inflation pull in opposite directions, including the 2022 hike cycle
Peek inside
Mandate 1: Maximum Employment
Lowest unemployment rate consistent with stable prices
Not zero unemployment - workers always between jobs
Fed estimates natural rate (u*) at about 4.0-4.5%
Unemployment below u* pushes inflation UP
Mandate 1: Maximum Employment
Maximum employment = the lowest unemployment rate consistent with stable .
It is NOT zero unemployment - workers are always between .
The Fed estimates the natural rate (u*) at about 4.0 - %.
Unemployment BELOW u* pushes inflation .
Mandate 2: Stable Prices
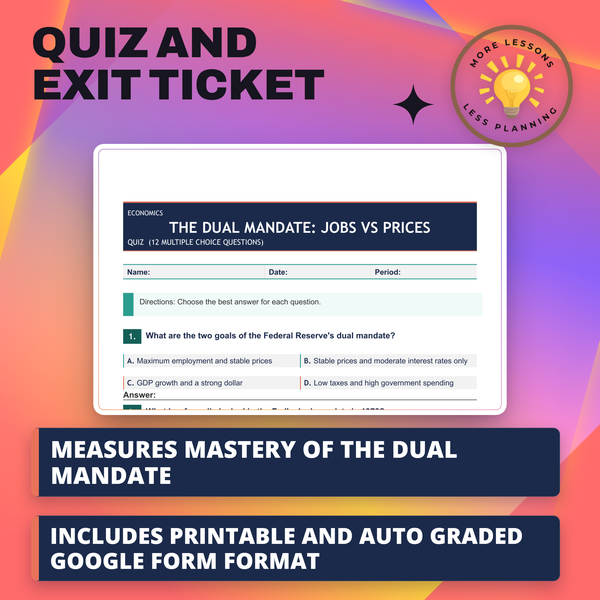
1. The Fed's legal mission - written into law by Congress in 1977-1978 - to pursue BOTH maximum employment AND low, steady inflation at the same time is called the .
Why this matters
For nearly a decade in the 1970s the normal rule broke: unemployment and inflation were supposed to trade off, and instead both climbed together into stagflation, reaching 7 percent unemployment and 13.5 percent inflation by 1980. That failure is why the Fed carries two legal jobs instead of one.
Students expect those goals to pull the same way, then they chart 2022 and find unemployment at 3.6 percent while inflation ran at 8 percent, the exact split that forces a real trade-off. I have them write the recommendation as if briefing the Fed chair directly, since committing to hike, hold, or split beats hedging both ways on paper.
From one teacher to another
The exact moment I built this lesson for is when a student says "the Fed just prints money," and everything here is designed to make that sentence harder to say afterward. Students work through two real scatter charts, not made-up numbers, tracing the 1961-1973 Phillips curve trade-off before watching it shatter in the 1974-1980 stagflation cluster, then jumping to 2015-2026 data to find the 2022 outlier sitting at 3.6% unemployment against 8% inflation. The activity puts them in the chair of a junior FOMC analyst named Dana Reyes, who has to write Chair Powell a memo in March 2022 recommending hike, hold, or split, and I grade the memo on whether they cite real chart values and a historical model, not on which side they land on. By the end they've also sat with average inflation targeting, the 2020 framework change that gets blamed for the Fed being slow to hike, and can explain why Powell name-checked Volcker on the way up.
Every file in this toolkit
-
Activity (Student)
Dana Reyes is prepping Chair Powell for a March 2022 meeting, so you study a Phillips-curve scatter from 1961 to 1980 to find the stagflation break, locate the 2022 outlier on a newer scatter, trace inflation's decline through 2026, then recommend hike, hold, or split in a memo.
-
Activity (Answer Key)
The 1980 stagflation point and the 2022 outlier both get exact coordinates, plus year-by-year inflation readings tracing the decline back toward target through 2026. A sample memo recommends a hike, citing Volcker as the historical model.
-
Exit Ticket (Student)
Quick questions name the Fed's two dual-mandate goals, identify what happened to unemployment and inflation together during 1970s stagflation, and name which mandate the Fed favored in 2022 and by what action. Whether the Fed made the right call putting prices ahead of jobs needs a defense.
-
Exit Ticket (Answer Key)
Maximum employment and stable prices name the two mandate goals, both rising together answers the stagflation question, and hiking the federal funds rate from 0.25 to 5.50 percent names the 2022 priority. Both goals, the 2022 conflict with a number, and a defended verdict complete the answer.
-
Guided Notes (Student)
A 1961 to 1980 Phillips curve scatter gets read for the year the trade-off broke into stagflation, 7 percent unemployment against 13.5 percent inflation, before students find the 2022 outlier at 3.6 percent unemployment against 9.1 percent inflation. A second scatter covers 2015 to 2026.
-
Guided Notes (Teacher Key)
Two laws behind the dual mandate stand dated, 1977's Reform Act and 1978's Humphrey-Hawkins law, next to the 1980 reading of 7 percent joblessness and inflation running 13.5 percent. The 2022 cycle's eleven moves and 5.25 point total rise carry full figures.
-
Quiz (Student)
Two scatter-chart items send students to a 1961-1980 Phillips curve graph and a 2015-2026 graph to find 1980's data point and the year that stands out as an outlier, plus a question on the law that locked in the dual mandate.
-
Quiz (Answer Key)
1980 pairs 7 percent unemployment against 13.5 percent inflation, 2022 gets marked as the outlier year, and Volcker's rate hikes get the credit for breaking 1970s inflation.
-
Slides
Humphrey-Hawkins locks the dual mandate into law on one slide, a 1961 to 1980 Phillips curve scatter breaks into stagflation next, 7% unemployment against 13.5% inflation by 1980, and a 2015 to 2026 chart flags 2022 at 3.6% unemployment against 9.1% inflation.
-
Teacher Guide
A hawks-versus-doves mock policy meeting puts the March 2022 numbers, an 8.5 percent reading against 3.6 percent unemployment, directly into student hands instead of a lecture. A companion discussion contrasts Volcker's hiking pace with Powell's.
Download
Where should I send the next one?
Everything here is free and it stays that way. Leave your email and I'll send you the new lessons as they go up. You can unsubscribe from any one of them.
Related resources
Deflation: Why Falling Prices Are Bad
Hyperinflation: Weimar, Zimbabwe, Venezuela
Interest Rates: The Fed's Main Tool
Jerome Powell: The Most Powerful Person You've Never Heard Of
The 2022-2024 Inflation Crisis
What Is the Federal Reserve?
Every lesson on this site is free to download and use. If one of them saved you a prep period, you can chip in a few bucks toward my three kids' daycare fund. That's genuinely where tips go.