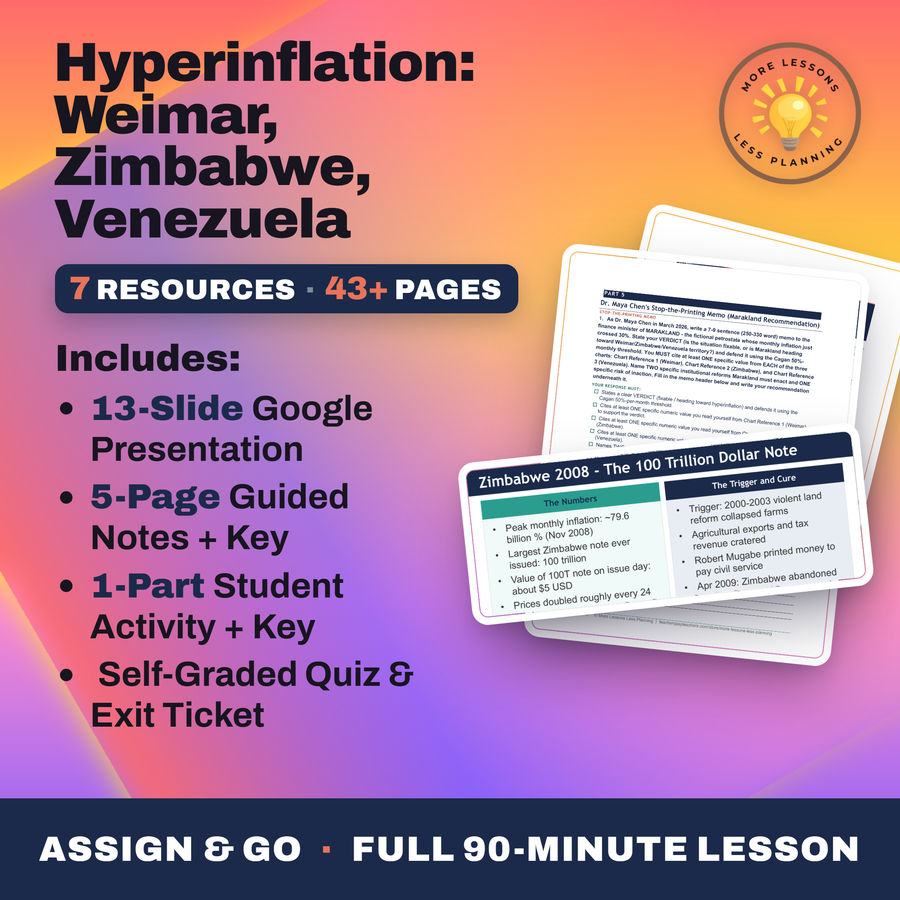

Hyperinflation: Weimar, Zimbabwe, Venezuela
Quality reviewed September 2026
- Grades
- Grades 9-12
- Time
- About two 50-minute class periods
- Includes
- 10 ready-to-teach files
- Format
- Word (.docx) · PowerPoint (.pptx)
- Slide deck
- Guided notes
- Guided notes teacher key
- Activity + answer key
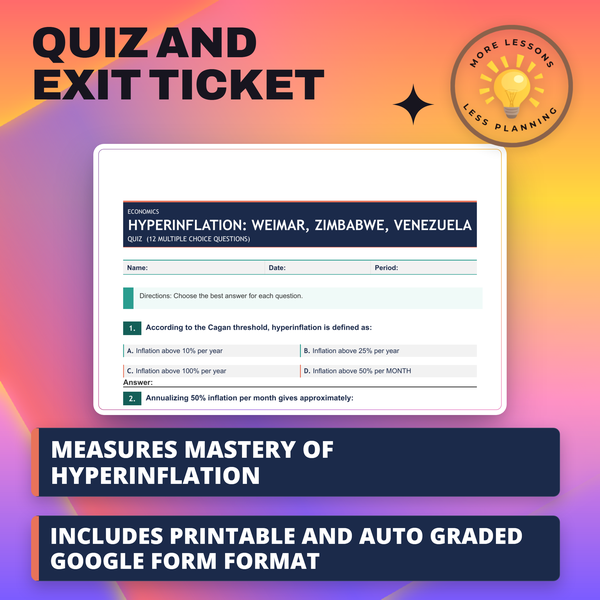
- Quiz + answer key
- Exit ticket + answer key
- Teacher guide
What students do
- Define hyperinflation using the Cagan 50%-per-month threshold and distinguish it from ordinary bad inflation
- Read log-scale inflation charts for Weimar Germany, Zimbabwe, and Venezuela and compute actual percentages from the y-axis
- Trace the shared five-step pattern behind all three hyperinflations, from fiscal pressure to printing money
- Write a memo to a fictional finance minister recommending whether a 30%-monthly crisis is still fixable
What it covers
- The Cagan threshold, 50% inflation or more per month, and how it dwarfs even a bad year like 2022's 9.1%
- Weimar Germany's November 1923 peak near 29,500% monthly, ended by the Rentenmark currency reform
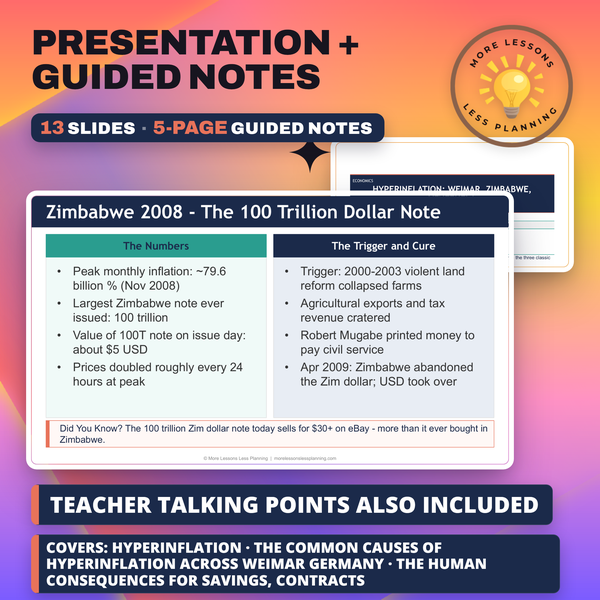
- Zimbabwe's 2008 peak of about 79.6 billion percent monthly and the 100 trillion dollar note
- Why the U.S. is unlikely to follow, given Fed independence, dollar reserve status, and a deep Treasury market
Learning targets
- Define hyperinflation using the Cagan threshold (50%+ monthly) and name the three classic cases
- Trace the common causes of hyperinflation across Weimar Germany 1923, Zimbabwe 2008, and Venezuela 2016-2020
- Evaluate the human consequences for savings, contracts, and political stability
Peek inside
The 50% Monthly Rule
Hyperinflation = 50%+ inflation per .
Defined by Phillip in his 1956 paper.
Annualized, 50% monthly is about % per year.
At 50% monthly, prices roughly double every days.
Why a Monthly Rule?
1. Inflation so fast that prices double in a matter of weeks - 50% or more per MONTH, the rate Phillip Cagan set as the dividing line in his 1956 paper - is . Normal inflation runs 2-3% per YEAR; this is roughly 1000 times larger.
Why this matters
Fifty percent inflation in a single month is the line economists use for hyperinflation, and Weimar Germany blew past it hundreds of times over, hitting near 29,500 percent in November 1923. Zimbabwe crossed an even steeper line in 2008, and Venezuela's collapse from its 2016 oil crash proves this can still happen today.
The five-step chain is identical every time: a government loses its revenue, cannot cut spending, cannot borrow, and prints money instead. Once a student can trace that chain from 1920s Germany to 2016 Venezuela unaided, a currency collapse stops reading as chaos and starts reading as a pattern.
From one teacher to another
I show students a real Zimbabwe 100 trillion dollar note before I define anything, because a banknote with that many zeros that was only worth about five U.S. dollars on the day it was issued gets attention no vocabulary list can match. From there they learn the actual dividing line, the Cagan threshold of 50 percent inflation per month, and read real log-scale charts for Weimar Germany, Zimbabwe, and Venezuela, doing the math to convert a y-axis reading back into an actual percentage instead of just eyeballing a line. What ties the three cases together is one five-step pattern: a government loses its normal revenue, can't cut spending, can't borrow anymore, and prints money instead, and once students see that same chain in a 1920s German reparations crisis, a 2008 Zimbabwean land-reform collapse, and a 2016 Venezuelan oil-price crash, they stop treating hyperinflation as ancient history. It ends with them advising a fictional finance minister whose country just crossed 30 percent a month, using specific numbers pulled off all three charts to argue whether the crisis is still fixable.
Every file in this toolkit
-
Activity (Student)
Dr. Maya Chen hands you log-scale inflation charts, so you convert axis readings into real percentages for Zimbabwe, Venezuela, and 1920s Weimar Germany, trace each collapse to its political trigger, then advise a fictional finance minister facing 30 percent monthly inflation.
-
Activity (Answer Key)
Every log10 conversion gets worked out in full, from Weimar's 29,500 percent peak to Zimbabwe's 79.6 billion percent and Venezuela's slower five-year climb to 65,374 percent. A sample memo cites all three charts before advising the fictional finance minister.
-
Exit Ticket (Student)
The ticket's questions define the Cagan threshold separating hyperinflation from ordinary bad inflation, name the shared cause behind Weimar, Zimbabwe, and Venezuela's collapses, and name the U.S. institutional feature that makes a repeat unlikely. One country-specific detail goes in the paragraph.
-
Exit Ticket (Answer Key)
Fifty percent monthly inflation is the Cagan line, printing money to cover deficits is the shared cause across all three countries, and Federal Reserve independence names the U.S. shield against a repeat. Partial credit tracks each missing piece.
-
Guided Notes (Student)
Zimbabwe, Venezuela, and Weimar Germany each get a log-scale chart students convert into an actual percent, from Weimar's 29,500 percent peak to Zimbabwe's 79.6 billion percent a month. A five-step pattern of printing money for deficits ties all three currencies together.
-
Guided Notes (Teacher Key)
The 4.2 trillion marks that equaled one dollar in Weimar Germany, Zimbabwe's $100 trillion note worth about $5, and Venezuela's 65,374 percent peak in 2018 all stand answered. The five-step doom loop and the four reasons the U.S. carries institutional shields carry their full explanations.
-
Quiz (Student)
Log-scale chart items send students to the November 1923 peak inside Weimar Germany's chart and to Zimbabwe's 2008 peak, and a separate item asks which group hyperinflation harms most and which one manages to adapt.
-
Quiz (Answer Key)
Weimar's monthly inflation peaks near 29,500 percent in 1923, Zimbabwe's climbs near 79.6 billion percent, and the Rentenmark currency reform gets credited with ending the German spiral.
-
Slides
November 1923's Weimar peak of 29,500 percent monthly, a 79.6 billion percent Zimbabwe peak in 2008, and Venezuela's 65,374 percent in 2018 line up on three separate inflation charts, with a real $100 trillion Zimbabwe note pictured on its own slide.
-
Teacher Guide
A ten minute lab doubles a snack item's price every sixty seconds so students run out of play money fast enough to feel what fifty percent monthly inflation does. A case study assigns Hungary's 1946 forint reform or Brazil's 1994 real alongside Germany's.
Download
Where should I send the next one?
Everything here is free and it stays that way. Leave your email and I'll send you the new lessons as they go up. You can unsubscribe from any one of them.
Related resources
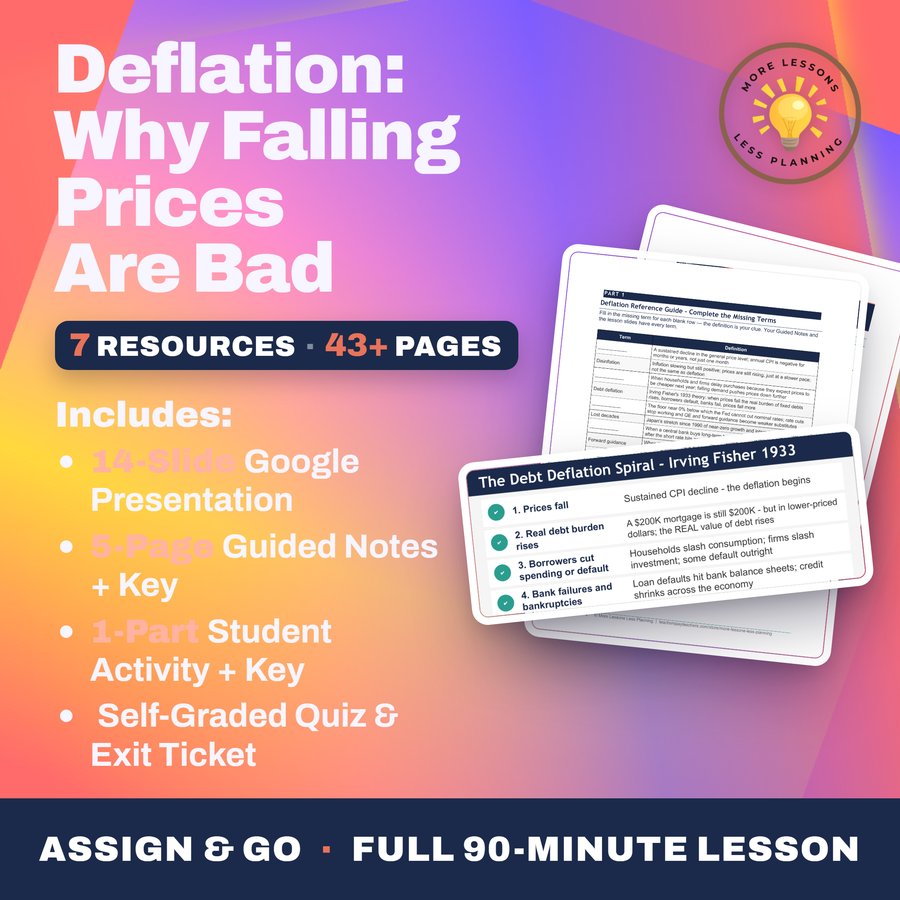
Deflation: Why Falling Prices Are Bad
Interest Rates: The Fed's Main Tool

Jerome Powell: The Most Powerful Person You've Never Heard Of
The 2022-2024 Inflation Crisis
The Dual Mandate: Jobs vs Prices

What Is the Federal Reserve?
Every lesson on this site is free to download and use. If one of them saved you a prep period, you can chip in a few bucks toward my three kids' daycare fund. That's genuinely where tips go.