
Deflation: Why Falling Prices Are Bad
Quality reviewed September 2026
- Grades
- Grades 9-12
- Time
- About two 50-minute class periods
- Includes
- 11 ready-to-teach files
- Format
- Word (.docx) · PowerPoint (.pptx)
- Slide deck
- Guided notes
- Guided notes teacher key
- Activity + answer key
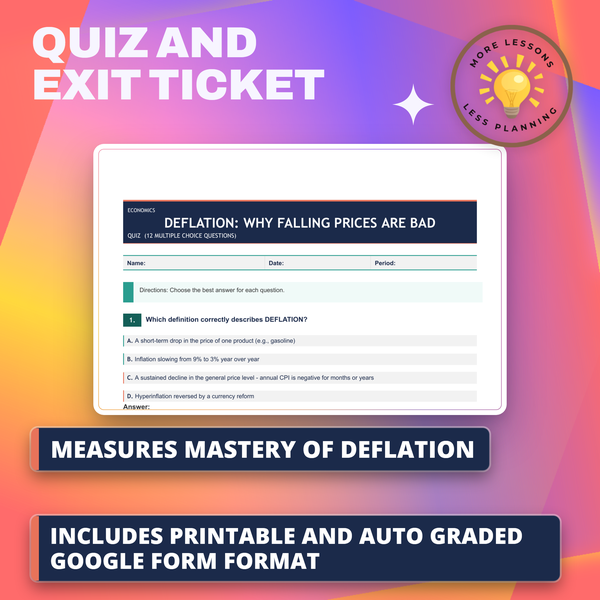
- Quiz + answer key
- Exit ticket + answer key
- Teacher guide
- Teacher presentation notes
What students do
- Distinguish deflation, sustained negative CPI, from disinflation, slowing but still positive inflation
- Read a Japan CPI chart (1985-2025) to find the first negative year, the 2009 trough, and the Abenomics recovery
- Read a U.S. CPI chart (1929-1939) to trace the Great Depression's deepening and its 1933-1934 policy pivot
- Write an FOMC memo recommending whether to pre-position for deflation risk, citing both charts
What it covers
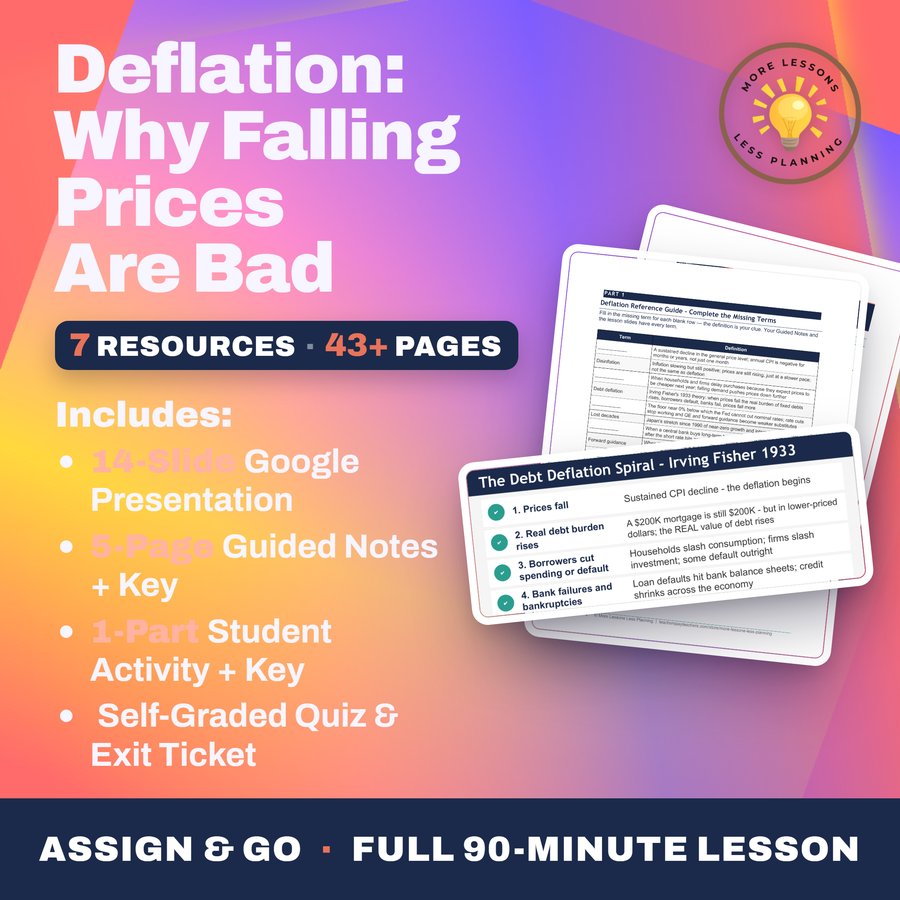
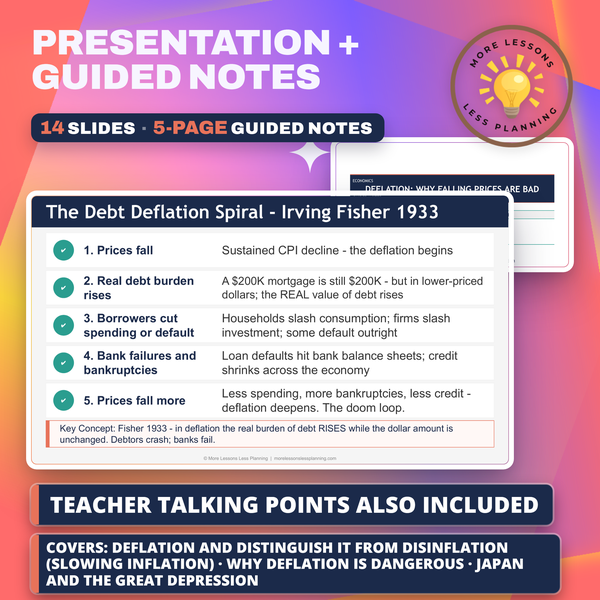
- Irving Fisher's 1933 debt-deflation spiral, where falling prices raise the real burden of fixed debts
- Japan's lost decades, with roughly 11 negative-CPI years between 1995 and 2012 and a trough of -1.4% in 2009
- The Great Depression's 25% cumulative price decline and the 1933 policy pivot that ended it
- Why the Fed fears deflation more than mild inflation, since rate cuts hit a floor near 0%, the zero lower bound
Learning targets
- Define deflation and distinguish it from disinflation (slowing inflation)
- Explain why deflation is dangerous (deferred spending + debt deflation)
- Trace Japan and the Great Depression; explain why the Fed fears deflation
Peek inside
What Counts as Deflation
Deflation = SUSTAINED decline in the general price level
Annual CPI is NEGATIVE for months or years, not one month
The opposite of inflation (rising prices)
Affects ALL prices on average, not just one good
What Counts as Deflation
Deflation = SUSTAINED decline in the general level.
Annual CPI is for months or years, not one month.
Deflation is the of inflation.
Affects ALL prices on , not just one good.
Not Just a Bargain
1. A SUSTAINED decline in the general price level - annual CPI negative for months or years, not just one month and not just one product - is called .
Why this matters
Falling prices sound like good news until you owe money on anything. Irving Fisher named this trap in 1933: a falling price level makes a fixed debt payment heavier in real terms, since the dollars paying it back are worth more than the dollars borrowed. Japan lived inside that trap for real, with prices falling for roughly eleven years between 1995 and 2012.
Most students assume cheaper is always better, and the debt math changes their mind fast. I have them find the exact year the U.S. broke its own deflation spiral, 1933, and explain what FDR changed that Japan could not replicate for nearly two decades.
From one teacher to another
The mistake I have to head off on day one is students calling 2022-2024 "deflation" because inflation was falling. It wasn't; prices kept rising the whole time, just more slowly, which is disinflation, a completely different animal from Japan's actual negative CPI years. Students read two real line charts side by side, Japan's CPI from 1985 to 2025 and the U.S. CPI through the Great Depression, and have to explain why the U.S. snapped out of its four-year deflation so much faster than Japan managed in eighteen. The short answer is FDR ending the gold standard in 1933, and I make them find that pivot on the chart itself rather than just take my word for it. It closes with a memo to an FOMC vice chair arguing whether the Fed should pre-position for deflation risk today, which forces them to use the zero lower bound as a real constraint instead of just a vocabulary word.
Every file in this toolkit
-
Activity (Student)
Renee Acosta lines up Japan's CPI history against the Great Depression's U.S. CPI record, covering 1985 through 2025 on one chart and 1929 through 1939 on the other, then writes an FOMC memo on whether to pre-position for 2026 deflation risk.
-
Activity (Answer Key)
Irving Fisher's 1933 debt-deflation theory frames the explanation, and the worked answers give the year-by-year CPI values for Japan's stretch below zero from 1995 to 2012 and the U.S. crash from 1929 to 1933, plus a sample memo defending a pre-position call with five vocabulary terms.
-
Exit Ticket (Student)
The ticket's questions separate deflation from disinflation with a year-over-year CPI test, ask for Irving Fisher's 1933 debt-deflation mechanism in one line, and probe why officials dread deflation far more than ordinary inflation. The rubric wants a reason tied to the zero lower bound.
-
Exit Ticket (Answer Key)
Sustained negative CPI, not merely slower growth, is what separates deflation from disinflation here, Fisher's 1933 mechanism comes down to a rising real debt burden, and the zero lower bound explains why deflation tools run dry before inflation tools do. Four points apply to the response.
-
Guided Notes (Student)
Japan's Nikkei peak of 38,915 in 1989 opens a slide toward eleven years of outright negative CPI across 1995 to 2012, bottoming at the 2009 trough of -1.4 percent before the 2013 Abenomics turn. The same chart set tracks the Great Depression's price slide from 1929 to 1933.
-
Guided Notes (Teacher Key)
Irving Fisher's five-step debt-deflation spiral stands answered line by line, alongside Japan's 38,915 Nikkei peak in 1989 and its negative CPI readings stretching from 1995 through 2012. The Great Depression's 25 percent price drop and its 9,000 bank failures carry full figures.
-
Quiz (Student)
Chart questions send students to the Japan and U.S. CPI graphs to find each country's single deepest year of falling prices, separate disinflation from real deflation, and define the zero lower bound.
-
Quiz (Answer Key)
The U.S. price trough falls in 1932 and Japan's in 2009, FDR's 1933 exit from the gold standard gets credited with ending the American spiral, and Irving Fisher's debt-deflation math explains why the cycle feeds on itself.
-
Slides
Japan's CPI chart from 1985 to 2025 marks the first negative year and the 2009 trough of negative 1.4 percent, right before a second chart tracks the U.S. price level falling 25 percent between 1929 and 1933.
-
Teacher Guide
A play money lab has students carry a $100,000 mortgage through five rounds of five percent price drops so the real debt burden grows even though the dollar figure never moves. Discussion work asks whether FDR's 1933 gold standard exit was defensible or just lucky.
-
Teacher Presentation Notes
Eleven or so negative years show up on Japan's chart card between a 1991 peak of 3.3 percent and a 2009 trough of negative 1.4 percent, and the U.S. chart that follows marks its own 1933 gold-exit turn.
Download
Where should I send the next one?
Everything here is free and it stays that way. Leave your email and I'll send you the new lessons as they go up. You can unsubscribe from any one of them.
Related resources

Hyperinflation: Weimar, Zimbabwe, Venezuela

Interest Rates: The Fed's Main Tool

Jerome Powell: The Most Powerful Person You've Never Heard Of
The 2022-2024 Inflation Crisis
The Dual Mandate: Jobs vs Prices

What Is the Federal Reserve?
Every lesson on this site is free to download and use. If one of them saved you a prep period, you can chip in a few bucks toward my three kids' daycare fund. That's genuinely where tips go.