
Taylor Swift Economics - Concert Ticket Pricing
Quality reviewed September 2026
- Grades
- Grades 9-12
- Time
- About two 50-minute class periods
- Includes
- 11 ready-to-teach files
- Format
- Word (.docx) · PowerPoint (.pptx)
- Slide deck
- Guided notes
- Guided notes teacher key
- Activity + answer key
- Quiz + answer key
- Exit ticket + answer key
- Teacher guide
- Teacher presentation notes
What students do
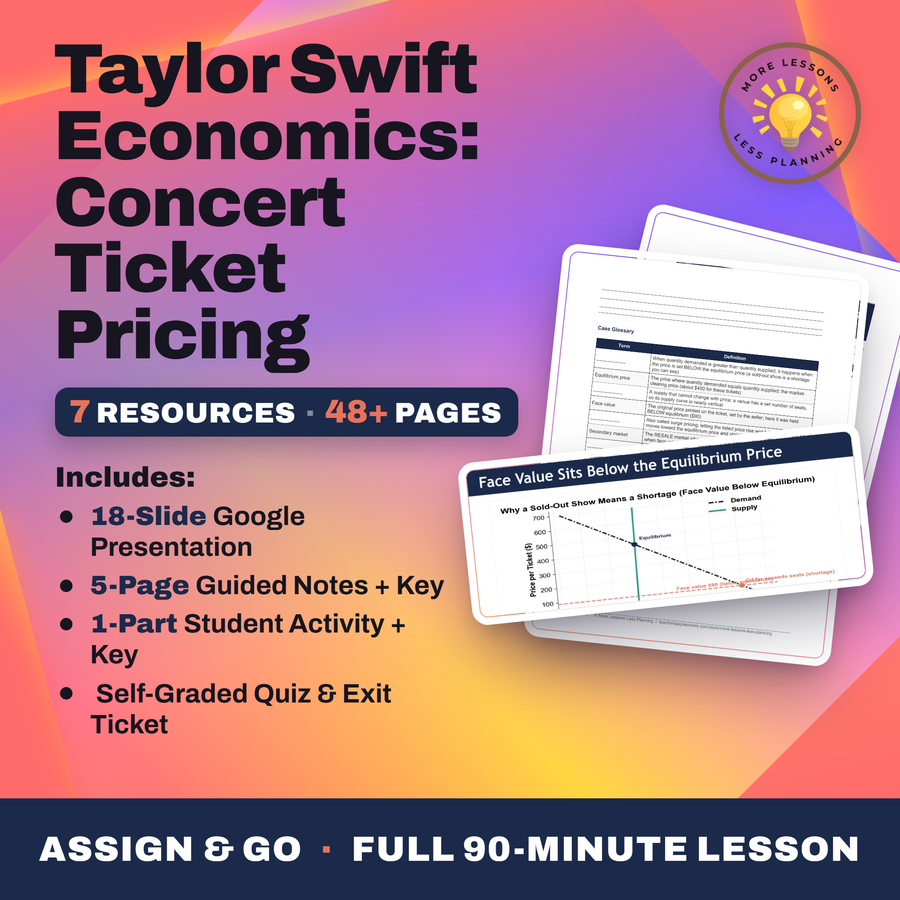
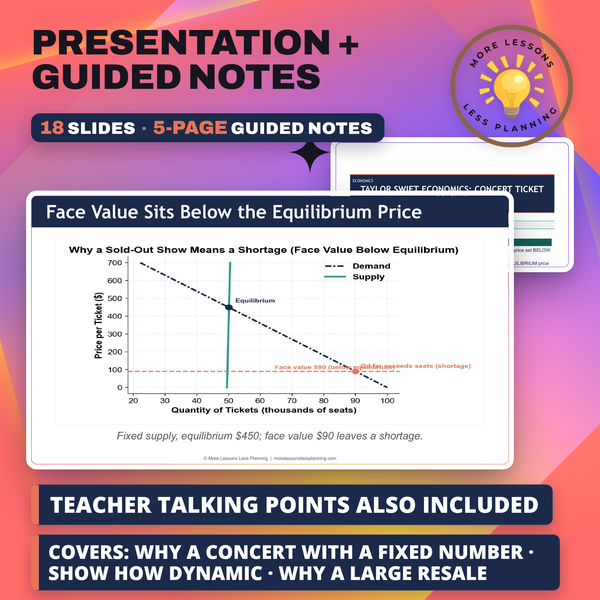
- Explain why a $90 face value set far below a $450 equilibrium price guarantees a shortage at a fixed-seat venue
- Trace dynamic surge pricing as a movement along the demand curve that shrinks the shortage as price rises toward equilibrium
- Read a resale chart to see Floor seats jump from a $450 face value to about $1,900 on the secondary market
- Distinguish a popularity-driven demand shift, which moved equilibrium from $300 to $450, from a price-driven movement along the curve
What it covers
- Why a fixed-seat venue's supply curve is basically a vertical line at the seat count
- The gap between a $90 face value and the roughly $450 price fans would actually pay
- Floor seats reselling around $1,900, and what that resale price reveals about the original shortage
- Telling apart a demand-curve shift from a movement along the curve, using the tour announcement versus surge pricing
Learning targets
- Explain why a concert with a fixed number of seats sells out in minutes - a price set BELOW equilibrium creates a SHORTAGE
- Show how dynamic ('surge') pricing lets the listed price rise toward the EQUILIBRIUM price and shrink the shortage
- Explain why a large RESALE (secondary) market with markups appears when face value is held below equilibrium
- Read a supply-and-demand chart to see how a popularity surge SHIFTS demand right and raises the equilibrium price against a fixed supply
Peek inside
What Fans Saw
Millions tried to buy at the same moment
The website crashed under the demand
Tickets 'sold out in minutes'
Then they appeared on resale for huge prices
The Meltdown and the Economics Behind It
When a hot tour goes on sale, millions try to buy at once and tickets sell out in .
A venue has a number of seats, so it cannot just make more tickets.
Demand for a hot tour is , far bigger than the number of seats.
A "sold-out" show is really a you can see.
1. WHY A SOLD-OUT SHOW IS A SHORTAGE. Riley Carter hands you the first chart. Use Chart Reference 1 (chart_face_value_shortage) - the face-value shortage chart shown below.
(a) Read the equilibrium off the chart: what is the equilibrium PRICE and the quantity of seats?
Why this matters
Half these students either tried to buy Eras Tour tickets themselves or watched a friend get shut out, so the meltdown is evidence, not a hypothetical. A $90 face value sitting far below the roughly $450 price fans would pay was a designed shortage, which is why Floor seats resold around $1,900.
I still watch students trip on separating the tour announcement, which shifted the whole demand curve from $300 to $450, from surge pricing, which just slides price up along that curve. Getting both terms right in the investigator's report is how I catch who actually understands the difference.
From one teacher to another
Half my students either tried to buy Eras Tour tickets themselves or watched a friend get shut out, so instead of explaining supply and demand from scratch I hand them the actual meltdown to investigate as evidence. They work out why a venue's supply curve is basically a vertical line at the seat count, then see that a $90 face value sitting way below the roughly $450 price fans would actually pay is a designed shortage, not an accident, and that gap is exactly what pushes Floor seats to around $1,900 on resale. The last piece is the one that trips people up even after they've got the shortage down: they have to tell apart the tour announcement itself, which shifted the whole demand curve right, from surge pricing, which just slides the price up along that same curve, before writing an investigator's report that uses both terms correctly.
Every file in this toolkit
-
Activity (Student)
Riley Carter is investigating why the Eras Tour sold out in minutes, so you read a shortage chart, a surge-pricing chart, and a resale-markup chart across four seat tiers, decide whether the price change slides along one curve or shifts it entirely, then close the case for the lead investigator.
-
Activity (Answer Key)
Every seat tier's face value and resale price get lined up, the $90-to-$450 surge is confirmed as a single-curve movement, and the announcement's $300-to-$450 equilibrium jump is confirmed as a full demand shift. A complete closing report sample wraps up the case for the lead investigator.
-
Exit Ticket (Student)
One question opens on a face value set far under market rate and what that gap causes, another asks whether dynamic pricing toward that rate is a shift or a slide along the demand curve, and a third asks why resale runs so high. Five required terms tie into one way the shortage could shrink.
-
Exit Ticket (Answer Key)
A face value set under the market rate is why the show sold out, a slide along that same curve is what dynamic pricing toward equilibrium produces, and that same underpriced ticket explains why resale runs so high. A named way to shrink the shortage joins all five terms for full credit.
-
Guided Notes (Student)
A $90 printed price sitting well under the $450 point where quantity demanded matches 50,000 seats gets diagnosed as a shortage, and students trace surge pricing sliding toward $450 while a popularity surge pushes equilibrium up from $300. A scalping and resale section closes the case.
-
Guided Notes (Teacher Key)
The $90 face value against the $450 equilibrium, the 50,000 fixed seats, and the $300 to $450 demand shift all come tallied with their sources. Scalping, dynamic pricing, and movement versus shift of the curve round out the page for quick use.
-
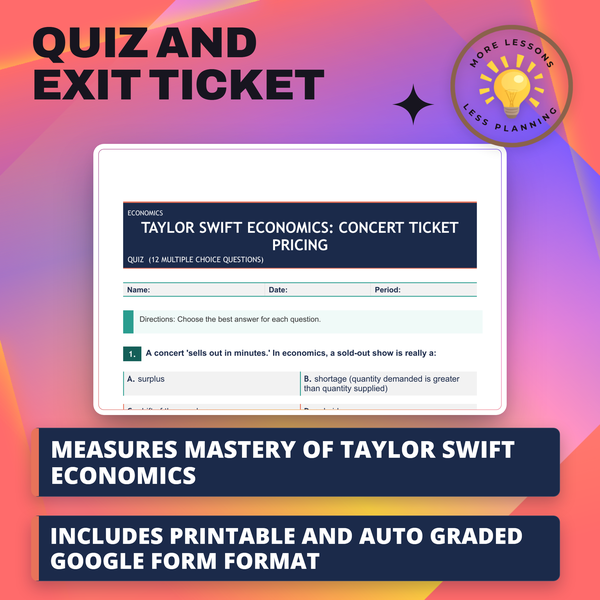
Quiz (Student)
Items anchor on the $90 sticker price against a roughly $450 clearing price, asking what a sold-out venue's fixed seat count does to its supply curve and why resale prices later spike.
-
Quiz (Answer Key)
Floor seats carry the widest gap between face value and resale, surge pricing gets described as a slide up the existing demand curve and not a new one, and the tour's own popularity gets credited with the price rise at a fixed seat count.
-
Slides
Face value printed at $90 next to the $450 point where the fixed seats actually clear explains the shortage, and a later resale chart shows Floor seats reaching about $1,900 once scalpers get involved.
-
Teacher Guide
One extension hands out a made-up fixed-seat arena with its own demand schedule and has students find the equilibrium price before setting a face value and predicting the resale gap. A companion debate argues whether dynamic pricing is fairer to fans than a low sticker price that feeds scalpers.
-
Teacher Presentation Notes
A fixed 50k-seat count sets up the vertical-supply explanation before face value and equilibrium get their numbers. The vocabulary segment defines scalping as profitable only when face value sits below equilibrium, a test students apply to the resale chart.
Download
Where should I send the next one?
Everything here is free and it stays that way. Leave your email and I'll send you the new lessons as they go up. You can unsubscribe from any one of them.
Related resources
Law of Demand - Why Price Matters
Law of Supply: The Producer Side
Market Equilibrium: Where Supply Meets Demand
Shortages and Surpluses
Surge Pricing: Uber, Hotels & Hurricane Plywood
Amazon Warehouses: Working Conditions Investigation
Every lesson on this site is free to download and use. If one of them saved you a prep period, you can chip in a few bucks toward my three kids' daycare fund. That's genuinely where tips go.