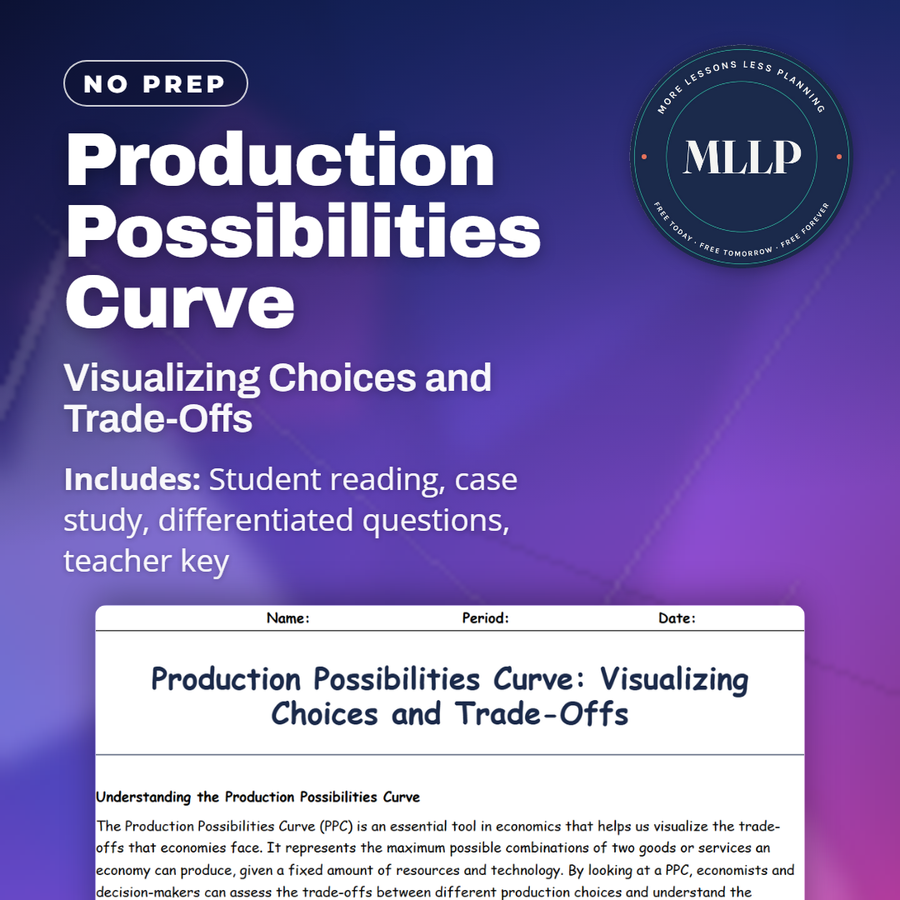
Production Possibilities Curve: Visualizing Choices and Trade-Offs
Quality reviewed September 2026
Facts verified September 8, 2026
- Grades
- Grades 9-12
- Length
- 7-page student worksheet
- Time
- About one 50-minute class period
- Great for
- Sub plans and independent work
- Includes
- Reading passage, comprehension questions + full answer key
- Format
- Print-and-go PDF
What students do
- Graph production options for widgets and gadgets to identify points along the curve that represent efficient production and points inside showing inefficiency
- Analyze World War II military production decisions to understand how shifting resources between consumer goods and military supplies demonstrates opportunity cost
- Determine what diminishing returns means by examining how costs increase as production of one good increases on the PPC
- Evaluate how technological advancements or new resources shift the PPC outward and expand an economy's production capacity
What it covers
- The Production Possibilities Curve showing maximum production combinations of two goods and the trade-offs inherent in resource allocation
- Efficiency versus inefficiency on the curve, with points on the curve representing efficient use of resources and points inside indicating underutilization
- Real-world application during World War II when the U.S. shifted resources from consumer goods like cars to military output like tanks and ammunition
Start reading this worksheet
Understanding the Production Possibilities Curve
The Production Possibilities Curve (PPC) is an essential tool in economics that helps us visualize the trade-offs that economies face. It represents the maximum possible combinations of two goods or services an economy can produce, given a fixed amount of resources and technology. By looking at a PPC, economists and decision-makers can assess the trade-offs between different production choices and understand the concept of opportunity cost. A simple example is an economy that can produce only two goods, such as cars and computers. The PPC shows us how many cars the economy can produce if it devotes all resources to car production, how many computers it can produce if it focuses entirely on computers, and the trade-offs if resources are split between both. Each point along the PPC represents a choice about how to allocate resources between these two goods, and each choice has an opportunity cost.
Example of a Production Possibilities Curve (PPC): Widgets vs. Gadgets
Let’s say our economy produces two goods: Widgets and Gadgets. Because resources are limited, the more we produce of one good, the less we can produce of the other. The PPC below shows five production options: Option A (0 Widgets, 100 Gadgets): All resources go to Gadgets. Option E (80 Widgets, 0 Gadgets): All resources go to Widgets. Options B, C, and D represent points where resources are shared between both goods. Each point along this curve shows a trade-off, highlighting the opportunity cost of shifting resources. If we choose more Widgets, we give up some Gadgets, and vice versa. This choice illustrates the trade-offs that define the PPC and helps us visualize opportunity costs in production.
Opportunity Cost and Trade-Offs on the PPC
Opportunity cost is a key concept illustrated by the PPC. When a choice is made to produce more of one good, there is a trade-off, as resources are taken away from producing another good. This trade-off creates an opportunity cost—the cost of the next best alternative forgone. For example, if our economy decides to produce more cars, the opportunity cost is the number of computers that won’t be produced. This trade-off highlights the limitations that every economy faces: because resources are finite, choosing to produce more of one good means producing less of another. The PPC curve slopes downward, reflecting this trade-off. The shape of the curve also gives us insight into opportunity costs. When the PPC is bowed outwards, it reflects increasing opportunity costs, meaning that as more resources are allocated to one good, the opportunity cost of producing additional units rises.
Like what you read? The full reading, the case study, and every question set are in the free download below, along with the answer key.
Why this matters
During World War II, American factories that had been building cars started building tanks and ammunition instead, and civilian car production nearly disappeared. That shift is a production possibilities curve in action: producing more of one good means producing less of another, using the same fixed labor, steel, and factory space.
Graphing widgets against gadgets makes the idea concrete before we mention a tank or a car. Students plot points showing waste inside the curve and points that are currently impossible outside it, then watch the whole curve shift outward as new technology or resources arrive. World War II is what makes the abstract graph feel like a real decision.
From one teacher to another
I use this worksheet when introducing how economies make choices with limited resources. The PPC makes trade-offs visual and concrete. My students map out production options for two goods and see immediately that producing more of one means producing less of the other. The World War II case study is powerful: students understand that when America shifted steel and labor to tanks and ammunition, civilian cars nearly stopped being made. That's a move along the curve, showing real opportunity cost. We discuss why points inside the curve represent waste or unemployment, and why points outside are currently impossible. When I show how technology or new resources shift the whole curve outward, students get economic growth. The worksheet drives home that every economy, every business, and every person faces the constraints shown on the PPC.
What you get
- Answer Key
-
Student Worksheet
At 60 widgets, adding 20 more costs 40 gadgets, while the first 20 widgets cost only 10, and that climbing price is why the curve bows outward. The table behind those numbers runs from 100 gadgets with no widgets to 80 widgets with none. A company making smartphones and laptops faces the same math, and an economy choosing between cars and computers sets up the idea at the start.
Download
Where should I send the next one?
Everything here is free and it stays that way. Leave your email and I'll send you the new lessons as they go up. You can unsubscribe from any one of them.
Related resources
Comparing Economic Systems: Market, Command, and Mixed
Economic Models and Theories: Simplifying Complex Concepts
Factors of Production: Building Blocks of the Economy
Marginal Analysis: Making the Most of Every Decision
Opportunity Cost: The True Cost of Every Decision
Rational Decision-Making in Economics: Balancing Benefits and Costs
Every lesson on this site is free to download and use. If one of them saved you a prep period, you can chip in a few bucks toward my three kids' daycare fund. That's genuinely where tips go.