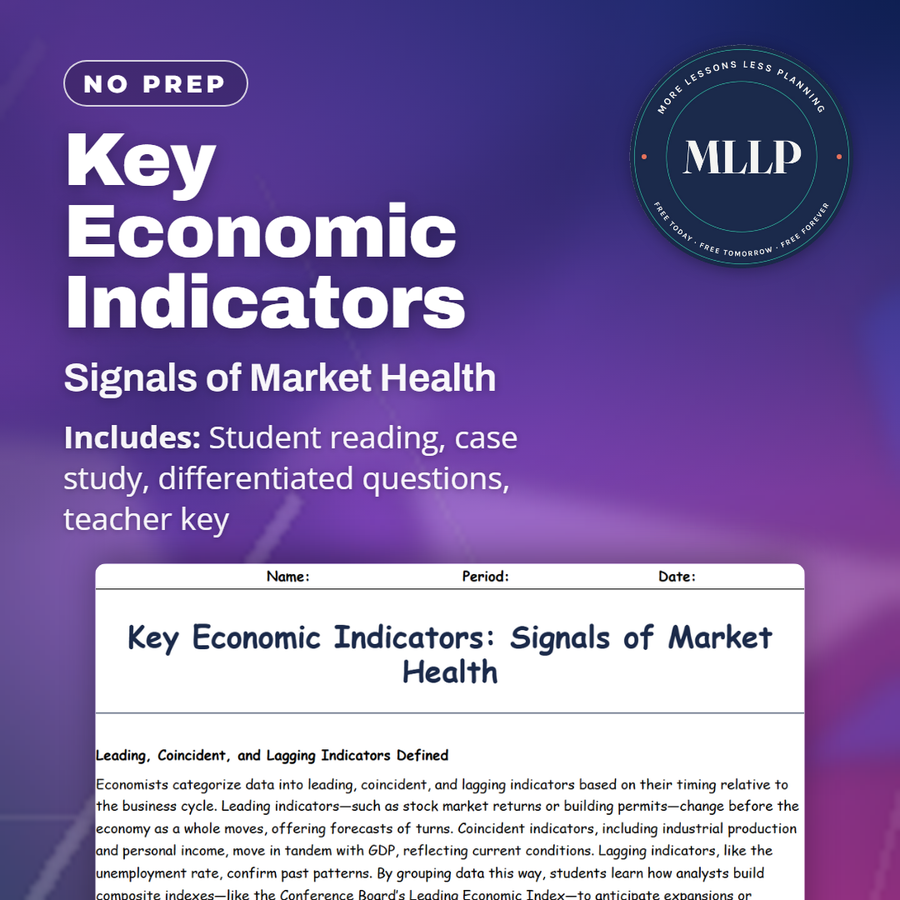
Key Economic Indicators: Signals of Market Health
Quality reviewed September 2026
Facts verified September 8, 2026
- Grades
- Grades 9-12
- Length
- 7-page student worksheet
- Time
- About one 50-minute class period
- Great for
- Sub plans and independent work
- Includes
- Reading passage, comprehension questions + full answer key
- Format
- Print-and-go PDF
What students do
- Classify indicators as leading, coincident, or lagging and explain why durable-goods orders forecast better than unemployment rates
- Examine the Conference Board Leading Economic Index and why composite indexes blend multiple indicators to reduce false signals
- Analyze how the 2008 recession warning signs appeared in mid-2007 (durable orders fell, factory workweeks shortened) before GDP declined
- Compare preliminary data revisions showing how initial recession estimates changed when complete data arrived months later
What it covers
- Leading indicators including new orders, consumer sentiment, and building permits that predict turns
- Coincident indicators like industrial production and payroll employment reflecting current conditions
- Lagging indicators such as unemployment confirming past shifts after the economy has already moved
Start reading this worksheet
Leading, Coincident, and Lagging Indicators Defined
Economists categorize data into leading, coincident, and lagging indicators based on their timing relative to the business cycle. Leading indicators, such as stock market returns or building permits, change before the economy as a whole moves, offering forecasts of turns. Coincident indicators, including industrial production and personal income, move in tandem with GDP, reflecting current conditions. Lagging indicators, like the unemployment rate, confirm past patterns. By grouping data this way, students learn how analysts build composite indexes, like the Conference Board’s Leading Economic Index, to anticipate expansions or recessions and guide policy and investment decisions.
Major Leading Indicators and Their Importance
Key leading indicators include new orders for durable goods, consumer sentiment surveys, average weekly hours worked in manufacturing, and building permits. A sustained rise in durable-goods orders signals businesses anticipate higher future demand, prompting capacity expansion. Positive consumer sentiment typically precedes increased household spending. Longer average workweeks imply firms need more labor, a precursor to hiring. By tracking several leading data points, policymakers can identify early signs of overheating or distress and act before broader GDP shifts occur.
Coincident and Lagging Indicators in Practice
Coincident indicators give real-time snapshots of economic activity. They include industrial production, manufacturing and trade sales, and employees on nonfarm payrolls. When these rise, GDP is usually growing; when they fall, a slowdown is underway. Lagging indicators change after the economy has shifted. They include the unemployment rate, labor-cost per unit of output, and commercial and industrial loans outstanding. A drop in unemployment lags behind recovery because firms wait to hire until confident growth will persist. Understanding lags helps students see why policy makers often wait for confirmation before altering rates or budgets.
Like what you read? The full reading, the case study, and every question set are in the free download below, along with the answer key.
Why this matters
The unemployment rate can look fine for months after a recession has already started, because it only confirms damage after it happens. In mid-2007, durable-goods orders had already fallen three straight months and the Leading Economic Index had slipped below trend, long before the housing collapse became undeniable.
Policymakers had the warning and hesitated anyway, because industrial production and payroll numbers still looked fine. I have them rank leading, coincident, and lagging indicators by how early each moves, then argue which single series they would trust least.
From one teacher to another
I use this reading to teach students that economic data tells a story, but timing matters. Leading indicators like durable-goods orders and consumer sentiment surveys signal what comes next, giving policymakers time to act. Coincident indicators like industrial production and payroll employment show what's happening right now. Lagging indicators like unemployment confirm changes after they've happened, which is why the unemployment rate can stay low even as a recession begins. The case study shows exactly this: in mid-2007, durable-goods orders fell three months straight and the Leading Economic Index dipped below trend, but policymakers hesitated because industrial production and employment looked fine. By late 2007, the housing collapse became undeniable. Students work through fill-in-the-blank and matching questions to distinguish indicator types, then answer why relying on any single series is risky and how three-month moving averages can smooth volatility in preliminary data.
What you get
- Answer Key
-
Student Worksheet
The Census Bureau, the Bureau of Labor Statistics, and the Federal Reserve collect the data behind these indicators, and initial GDP estimates get revised months later as fuller numbers arrive. Unemployment stayed low until mid-2008 despite warning signs already flashing, then reached about 7.3 percent by year's end, a lag behind the downturn it measured. A composite index can weight new orders, stock prices, and sentiment at 20 percent each.
Download
Where should I send the next one?
Everything here is free and it stays that way. Leave your email and I'll send you the new lessons as they go up. You can unsubscribe from any one of them.
Related resources
Business Cycles Demystified: Boom, Bust, and Recovery
Economic Growth & Productivity: Drivers of Prosperity
GDP Explained: Understanding the Economy’s Core Metric
Stability Factors: What Keeps the Economy Steady?
Trade Balance Impact: How Exports and Imports Shape GDP
Unemployment Uncovered: Rate and Labor Force Insights
Every lesson on this site is free to download and use. If one of them saved you a prep period, you can chip in a few bucks toward my three kids' daycare fund. That's genuinely where tips go.