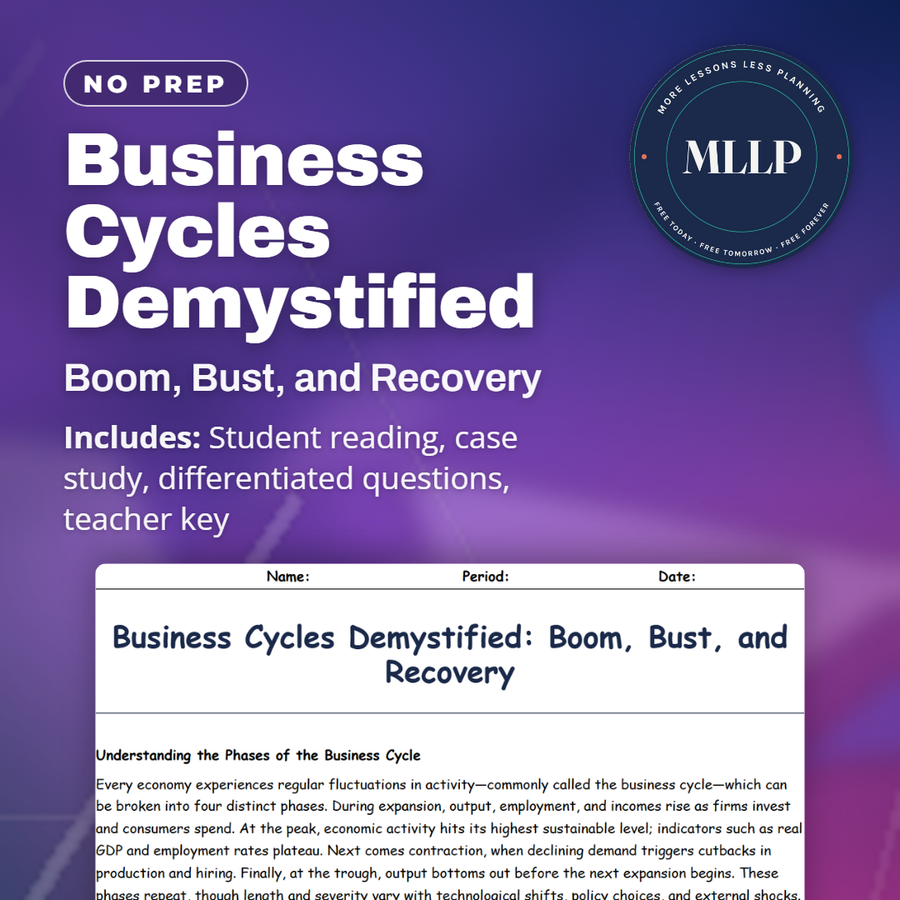
Business Cycles Demystified: Boom, Bust, and Recovery
Quality reviewed September 2026
Facts verified September 8, 2026
- Grades
- Grades 9-12
- Length
- 7-page student worksheet
- Time
- About one 50-minute class period
- Great for
- Sub plans and independent work
- Includes
- Reading passage, comprehension questions + full answer key
- Format
- Print-and-go PDF
What students do
- Analyze four phases of the business cycle (expansion, peak, contraction, trough) and match them to real economic conditions
- Examine the 2008 recession case study to trace how housing collapse triggered broader financial crisis
- Match key terms like recession, quantitative easing, and AD-AS model to their definitions
- Answer short-response questions about automatic stabilizers and policy lag times
What it covers
- Business cycle phases and their effects on output, employment, and prices
- Leading, coincident, and lagging indicators for predicting economic turns
- Aggregate demand and aggregate supply model for analyzing policy responses
Start reading this worksheet
Understanding the Phases of the Business Cycle
Every economy experiences regular fluctuations in activity, commonly called the business cycle, which can be broken into four distinct phases. During expansion, output, employment, and incomes rise as firms invest and consumers spend. At the peak, economic activity hits its highest sustainable level; indicators such as real GDP and employment rates plateau. Next comes contraction, when declining demand triggers cutbacks in production and hiring. Finally, at the trough, output bottoms out before the next expansion begins. These phases repeat, though length and severity vary with technological shifts, policy choices, and external shocks. Understanding each phase helps students recognize why growth sometimes slows or even reverses, and prepares future policymakers and investors to anticipate turning points.
Causes and Indicators of Recessions and Recoveries
Recessions, a prolonged contraction, can stem from collapsing asset bubbles, sudden spikes in commodity prices, or financial crises that choke off credit. Central banks may tighten monetary policy to curb inflation, inadvertently tipping the economy into downturn. Conversely, recoveries often arise when central banks and governments deploy expansionary tools, such as lowering interest rates or increasing public spending, to restart demand. Economists track leading indicators like manufacturing orders, housing starts, and consumer sentiment to predict turning points; coincident indicators such as industrial production confirm real-time conditions; lagging indicators, like the unemployment rate, validate what’s already occurred. By monitoring this mix, policymakers aim to smooth extremes, reducing the amplitude of booms and busts.
Aggregate Demand, Aggregate Supply, and Policy Responses
At the heart of cycle analysis lie the curves for aggregate demand (AD) and aggregate supply (AS). An outward shift in AD, driven by rising consumption, investment, or government purchases, fuels expansion and can push the price level up. A contractionary AS shock, such as an oil embargo, can raise prices while reducing output, creating stagflation. To counter a downturn, fiscal authorities may boost spending or cut taxes (shifting AD right), while the central bank can lower interest rates and purchase assets (increasing the money supply). But each policy has lags: it takes time to draft budgets or for rate cuts to filter through bank loans. Students should grasp these mechanisms to appreciate why crises aren’t always met with instant relief.
Like what you read? The full reading, the case study, and every question set are in the free download below, along with the answer key.
Why this matters
Every recession feels sudden, but the 2008 case study shows months of buildup before Lehman Brothers collapsed: a housing downturn, then frozen credit, then fear spreading through the economy. That chain is what makes the four cycle phases feel like a real pattern, not four terms to memorize.
The gap between when a recession starts and when unemployment peaks trips students up most, since coverage makes it sound instant. I have them compare leading indicators like consumer sentiment against lagging ones like unemployment to explain that delay, and automatic stabilizers stop sounding like jargon.
From one teacher to another
I use this reading to help my high school economics students understand why economies don't grow in a straight line. Students work through passages explaining the four cycle phases, then dig into the 2008 recession to see how one shock cascades into widespread job loss and policy response. The case study shows real consequences: Lehman Brothers collapse, credit freeze, consumer fear, and the Federal Reserve's response through asset purchases and stimulus. By analyzing this concrete event alongside the theory, students grasp why policymakers watch leading indicators like consumer sentiment and manufacturing orders, and why there's often a lag between when a recession starts and when unemployment peaks. The worksheet includes fill-in-the-blank and matching sections to reinforce vocabulary around recessions, monetary easing, and automatic stabilizers.
What you get
- Answer Key
-
Student Worksheet
An oil embargo can push prices up while output falls at the same time, a mix the reading calls stagflation, born from a supply shock and not the ordinary demand swings behind expansion and contraction. During the 2008 downturn, Congress passed the Troubled Asset Relief Program to inject capital into banks while extending unemployment benefits and funding infrastructure work, on top of the Federal Reserve's near zero rate cut.
Download
Where should I send the next one?
Everything here is free and it stays that way. Leave your email and I'll send you the new lessons as they go up. You can unsubscribe from any one of them.
Related resources
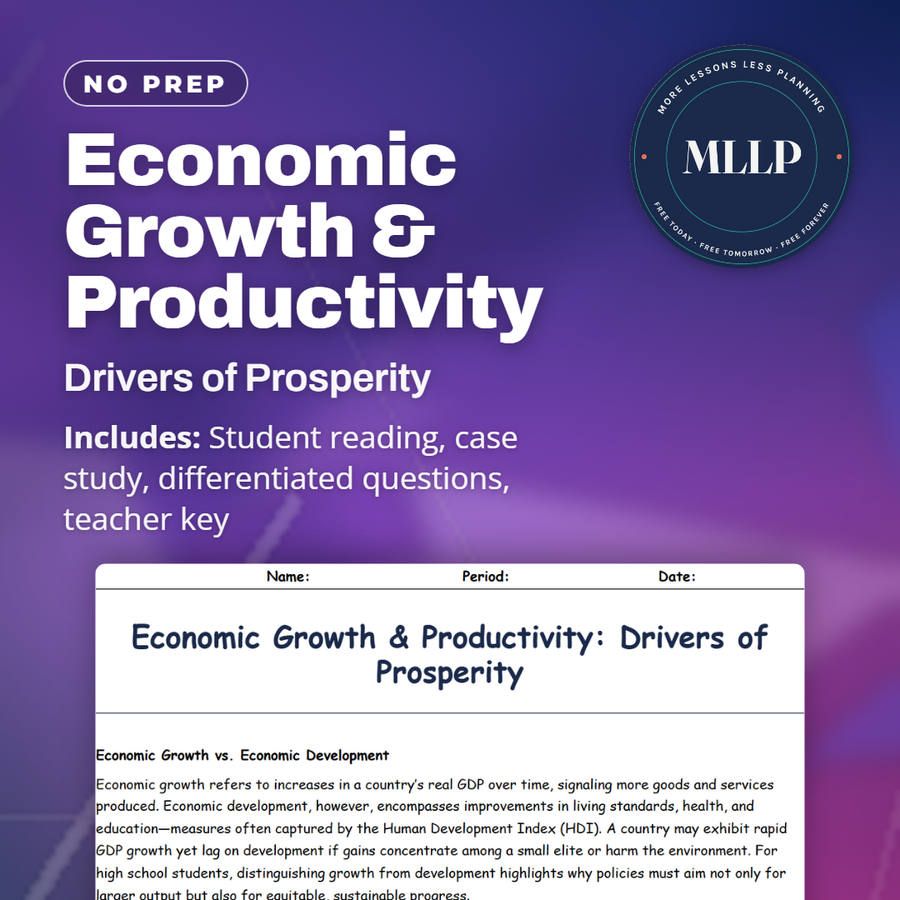
Economic Growth & Productivity: Drivers of Prosperity
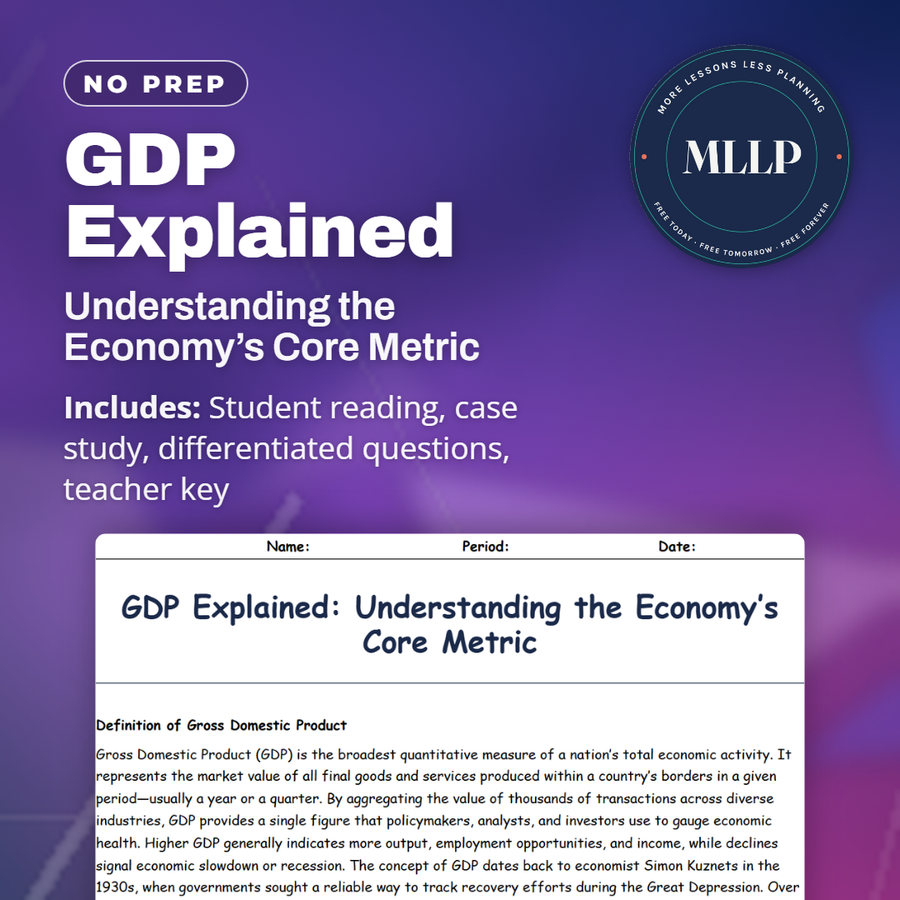
GDP Explained: Understanding the Economy’s Core Metric

Key Economic Indicators: Signals of Market Health
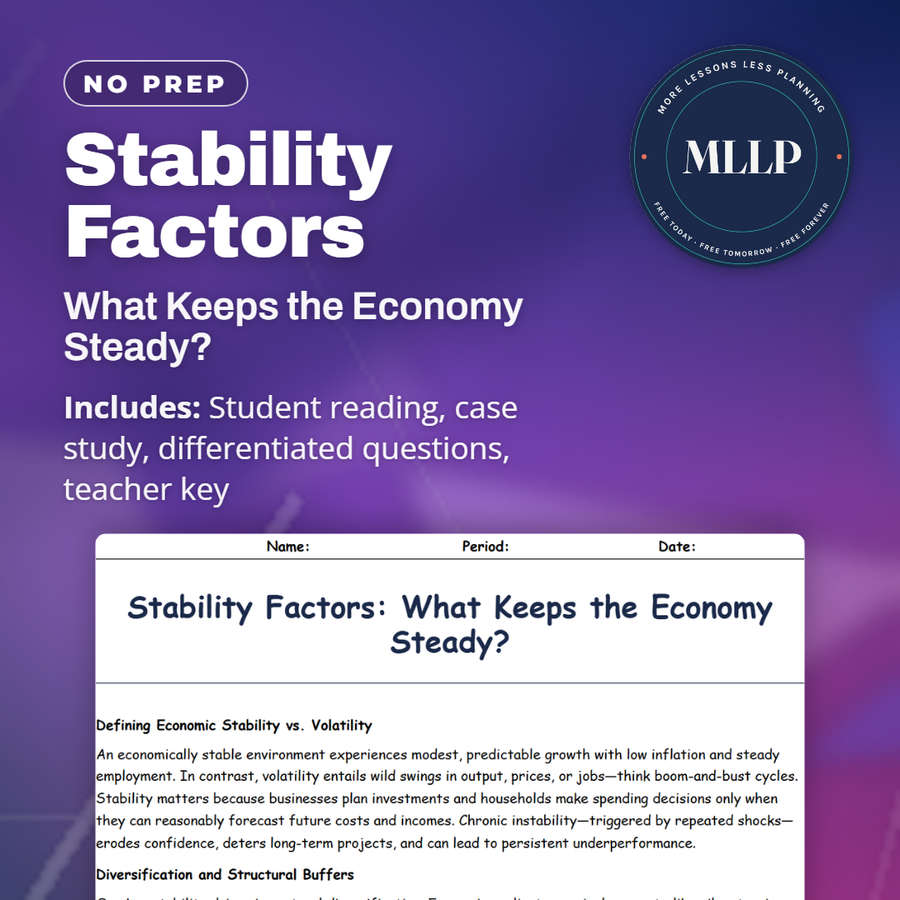
Stability Factors: What Keeps the Economy Steady?
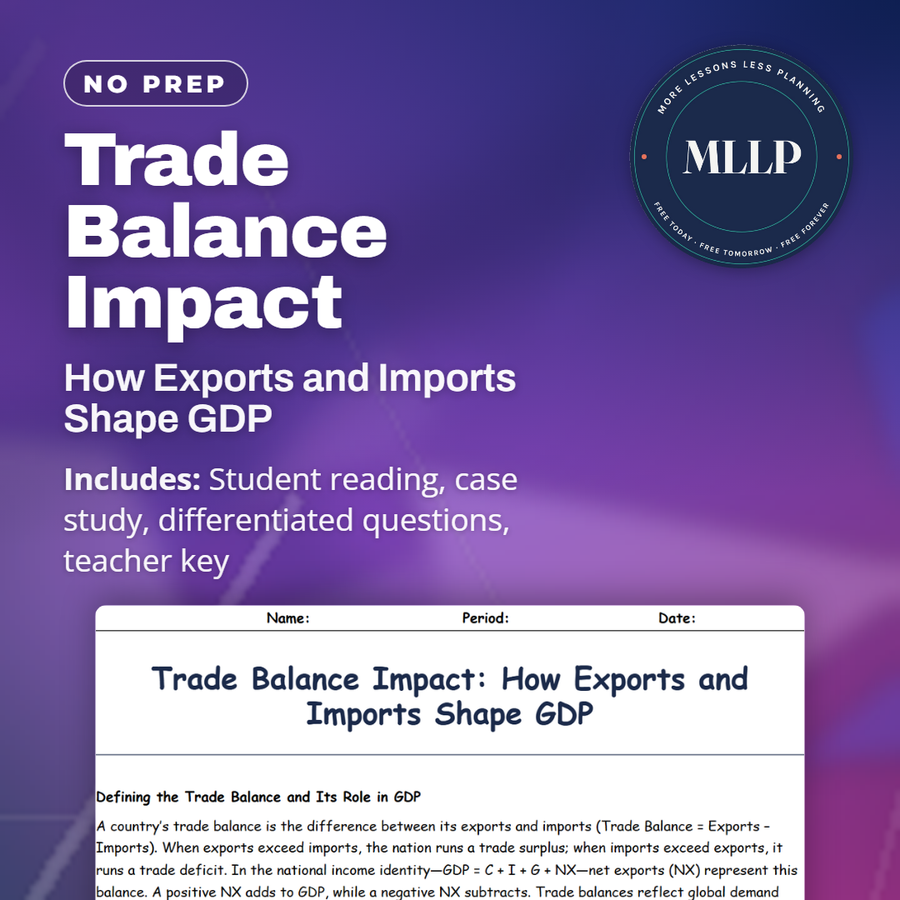
Trade Balance Impact: How Exports and Imports Shape GDP
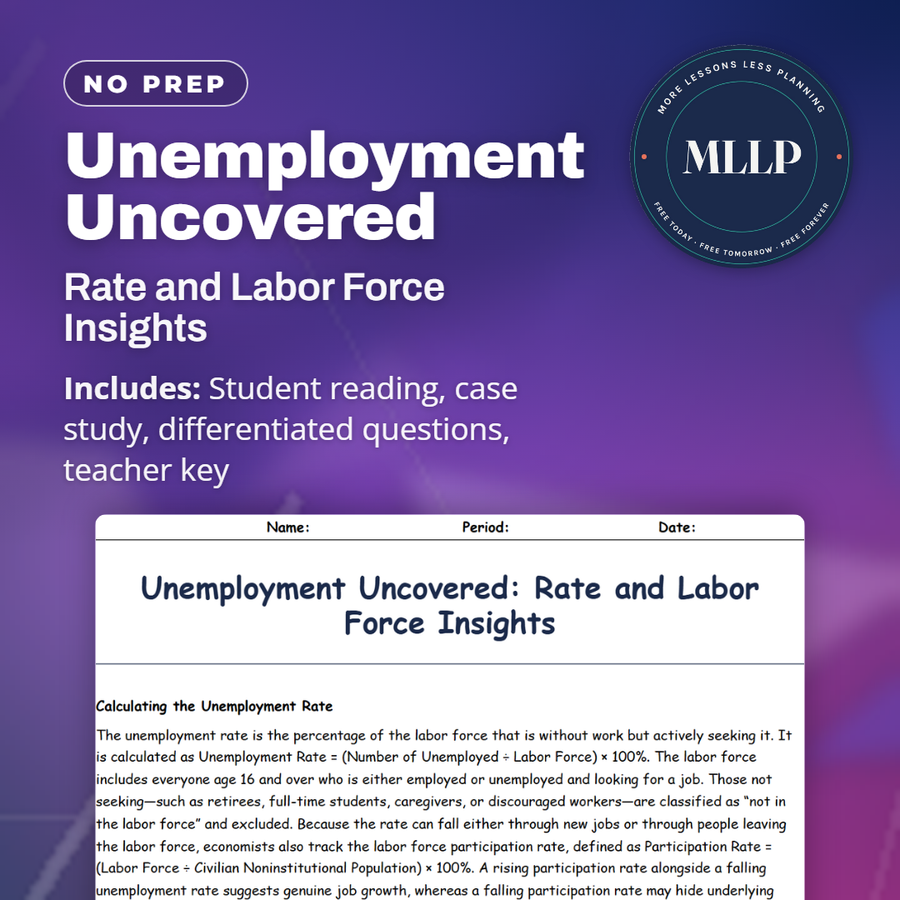
Unemployment Uncovered: Rate and Labor Force Insights
Every lesson on this site is free to download and use. If one of them saved you a prep period, you can chip in a few bucks toward my three kids' daycare fund. That's genuinely where tips go.