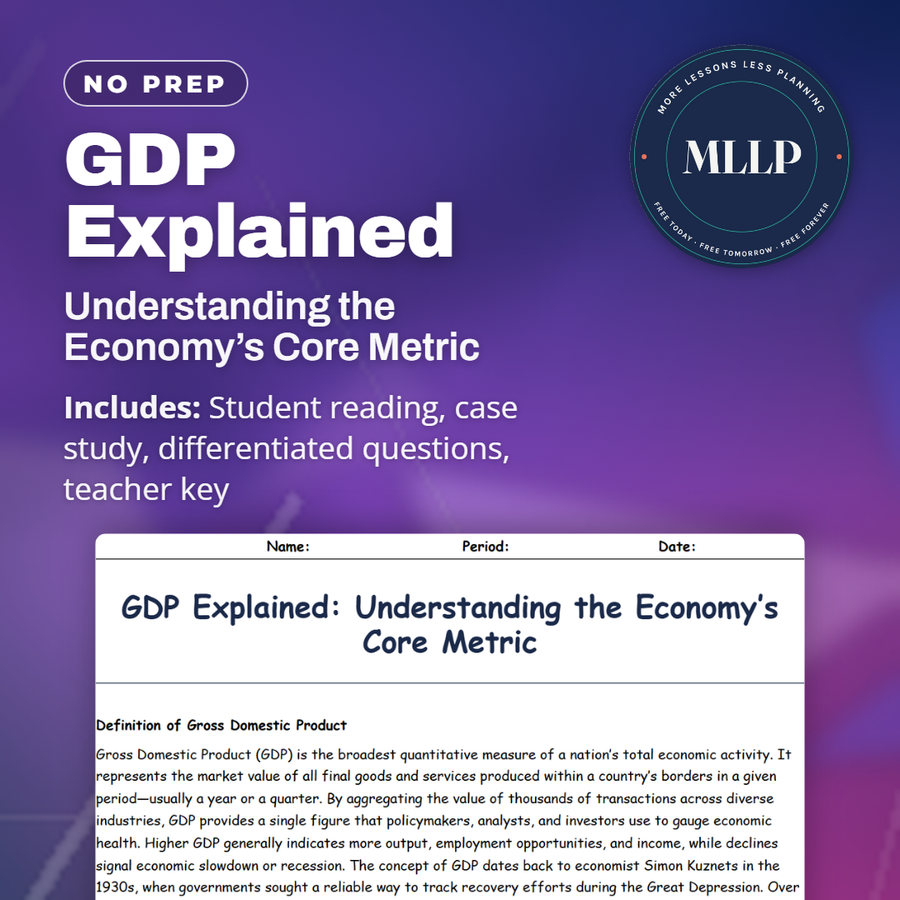
GDP Explained: Understanding the Economy’s Core Metric
Quality reviewed September 2026
Facts verified September 8, 2026
- Grades
- Grades 9-12
- Length
- 7-page student worksheet
- Time
- About one 50-minute class period
- Great for
- Sub plans and independent work
- Includes
- Reading passage, comprehension questions + full answer key
- Format
- Print-and-go PDF
What students do
- Calculate GDP using the expenditure formula (consumption, investment, government spending, net exports) with real-world spending examples
- Convert Nominal GDP to Real GDP using the GDP deflator to remove inflation and see actual output changes
- Trace the 2008 recovery showing how ARRA stimulus, Fed rate cuts, export growth, and consumer spending each contributed to positive growth
- Explain why GDP per capita provides better cross-country living-standard comparisons than total GDP alone
What it covers
- Expenditure and income approaches to calculating GDP and why both methods yield the same total
- Nominal versus Real GDP and the GDP deflator for removing price distortions
- Components of GDP including consumption, investment, government purchases, and net exports
Start reading this worksheet
Definition of Gross Domestic Product
Gross Domestic Product (GDP) is the broadest quantitative measure of a nation’s total economic activity. It represents the market value of all final goods and services produced within a country’s borders in a given period, usually a year or a quarter. By aggregating the value of thousands of transactions across diverse industries, GDP provides a single figure that policymakers, analysts, and investors use to gauge economic health. Higher GDP generally indicates more output, employment opportunities, and income, while declines signal economic slowdown or recession. The concept of GDP dates back to economist Simon Kuznets in the 1930s, when governments sought a reliable way to track recovery efforts during the Great Depression. Over time, GDP became the standard metric for cross-country comparisons and growth forecasts. However, while GDP captures output, it omits nonmarket activities (such as household labor and informal trade), ignores environmental costs, and does not reflect income distribution. As a result, GDP should be interpreted alongside other measures (like the Human Development Index or Gini coefficient) to form a more complete picture of societal well-being.
Expenditure vs. Income Approaches
There are two primary methods for calculating GDP: the expenditure approach and the income approach. The expenditure approach sums the total spending on final goods and services, encapsulated in the formula: GDP = C + I + G + (X – M) • Consumption (C): household outlays on goods and services, from groceries to streaming subscriptions • Investment (I): business spending on machinery, structures, residential construction, and inventory changes • Government Spending (G): purchases of goods and services by government entities (excluding transfer payments like Social Security) • Net Exports (X – M): the difference between a country’s exports (X) and imports (M) Alternatively, the income approach tallies all incomes earned by production factors: wages, rent, interest, and profits. Because every dollar spent by consumers, businesses, or governments becomes income for someone else in the economy, the two approaches, expenditure and income, must yield the same total GDP figure. Each component responds differently to economic forces: during downturns, consumption may drop as households tighten budgets, while government spending can serve as a cushion through fiscal stimulus. Similarly, rising exports boost net exports when global demand is strong.
Nominal vs. Real GDP and Price-Level Adjustment
Nominal GDP measures economic output using current market prices, but it can be misleading when comparing across time because it conflates changes in production with changes in prices (inflation or deflation). To strip out price effects, economists calculate Real GDP, which uses a price index (often the GDP deflator) to adjust nominal figures: Real GDP = (Nominal GDP) ÷ (GDP Deflator) × 100 By comparing Real GDP over multiple periods, analysts can determine whether output is genuinely expanding or contracting. For example, if Nominal GDP rises by 5% but the GDP deflator shows prices increased by 3%, Real GDP growth is only about 2%. Policymakers focus on Real GDP when setting interest rates, because it reflects actual production changes, not just higher prices.
Like what you read? The full reading, the case study, and every question set are in the free download below, along with the answer key.
Why this matters
A grocery run, a factory buying equipment, and a town breaking ground on federally funded road work all show up inside the same number. GDP adds spending by households, businesses, government, and net trade into one figure, which is why it drives nearly every economics discussion after it.
Most students assume a rising GDP means everyone is better off, so I have them separate nominal from real growth using the 2008 recovery, when ARRA tax cuts, Fed rate cuts, and a weaker dollar pulled on different pieces of the formula at once. The equation stops being abstract and starts explaining an actual year.
From one teacher to another
I use this reading when students need to understand why GDP is central to every economics discussion. The passage breaks down the formula students will see repeatedly: GDP = C + I + G + (X - M). Students work through examples like household grocery spending (consumption), factory equipment purchases (investment), federal highway funding (government), and the difference between what America exports versus imports (net exports). The worksheet emphasizes why Nominal GDP can mislead: if nominal GDP grows 5% but prices rose 3%, real output only expanded 2%. Students study the 2008 recovery where the American Recovery and Reinvestment Act (ARRA) provided tax cuts and infrastructure spending, while the Federal Reserve slashed rates and bought securities. By analyzing how consumption rebounded, technology firms invested cheaply, and exports benefited from a weaker dollar, students see how fiscal and monetary policy levers push on different GDP components.
What you get
- Answer Key
-
Student Worksheet
Economist Simon Kuznets developed GDP in the 1930s so Depression-era governments could track whether recovery efforts were working, and the reading still uses his logic to separate real growth from mere price increases. If Nominal GDP rises 5 percent while the GDP deflator shows prices up 3 percent, Real GDP grew only about 2 percent, the calculation policymakers rely on before raising interest rates.
Download
Where should I send the next one?
Everything here is free and it stays that way. Leave your email and I'll send you the new lessons as they go up. You can unsubscribe from any one of them.
Related resources

Business Cycles Demystified: Boom, Bust, and Recovery
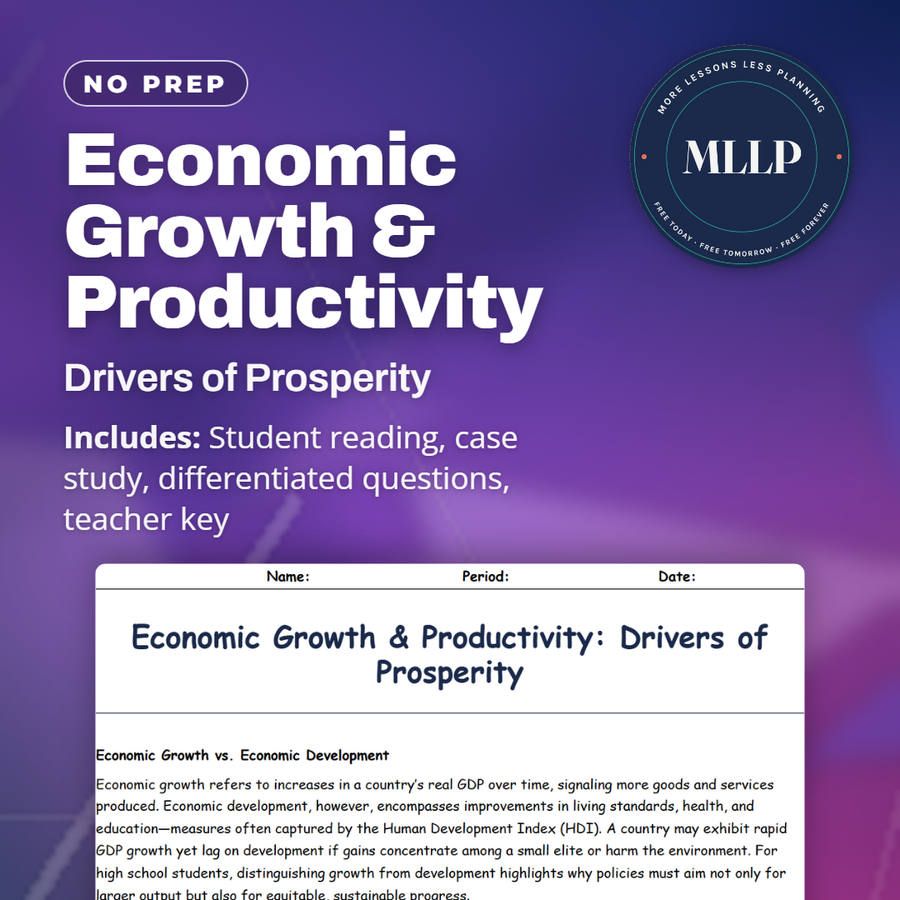
Economic Growth & Productivity: Drivers of Prosperity
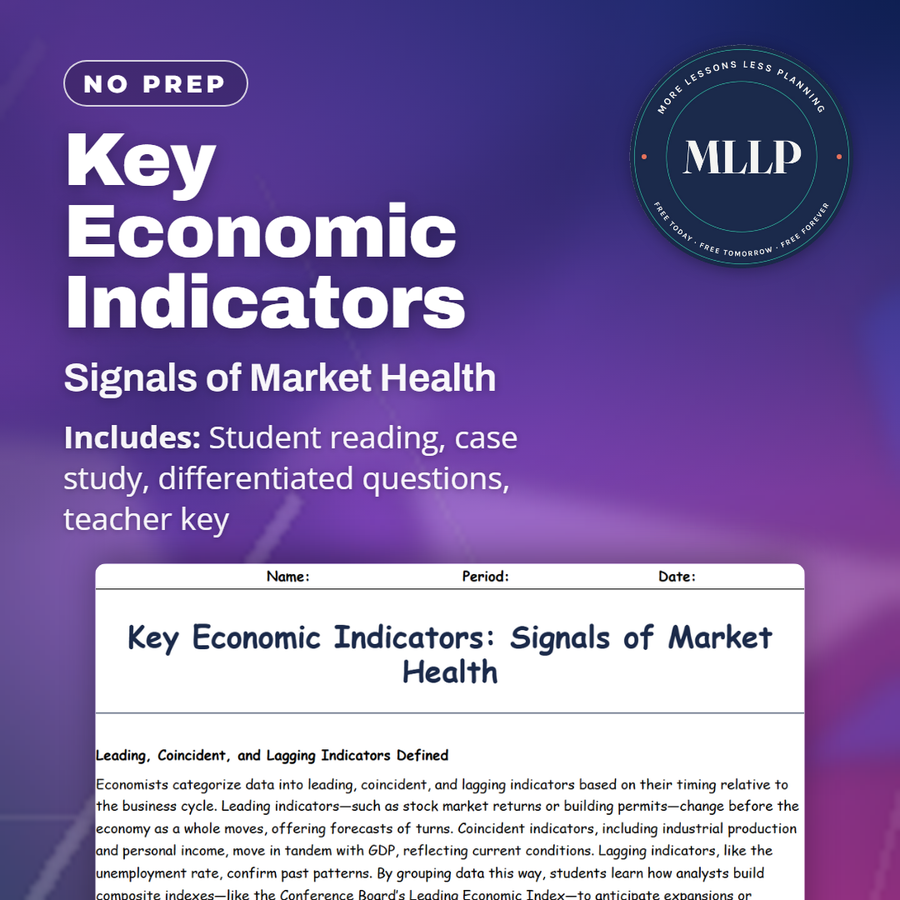
Key Economic Indicators: Signals of Market Health
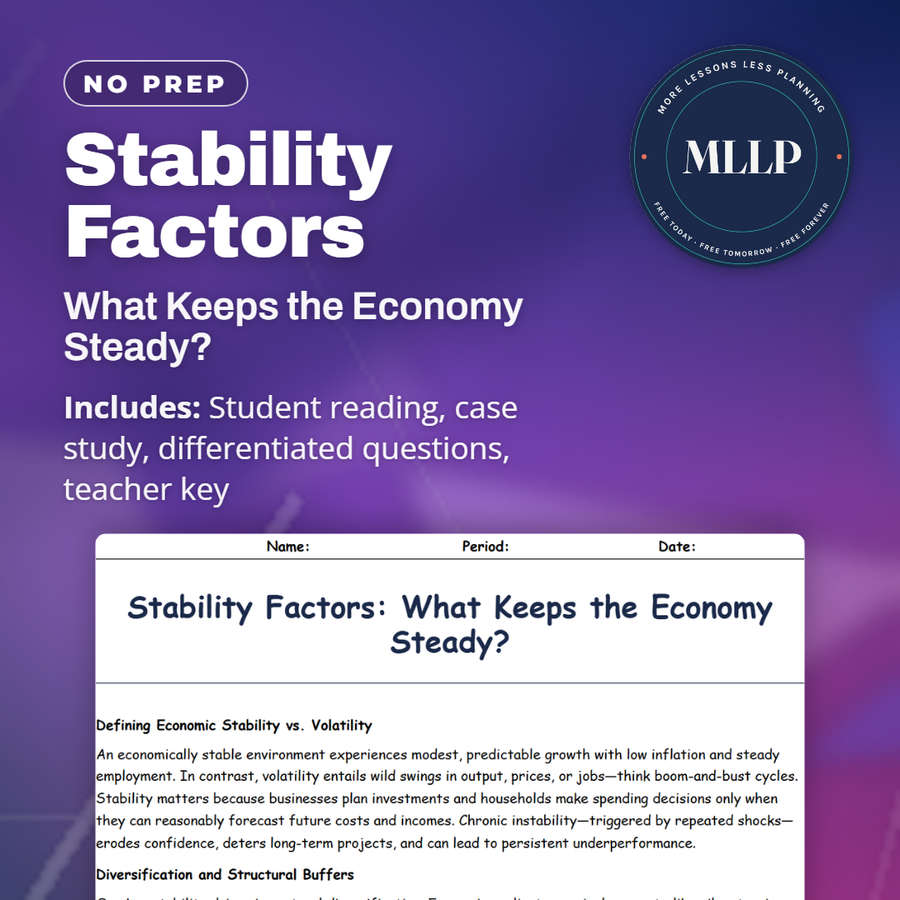
Stability Factors: What Keeps the Economy Steady?
Trade Balance Impact: How Exports and Imports Shape GDP
Unemployment Uncovered: Rate and Labor Force Insights
Every lesson on this site is free to download and use. If one of them saved you a prep period, you can chip in a few bucks toward my three kids' daycare fund. That's genuinely where tips go.