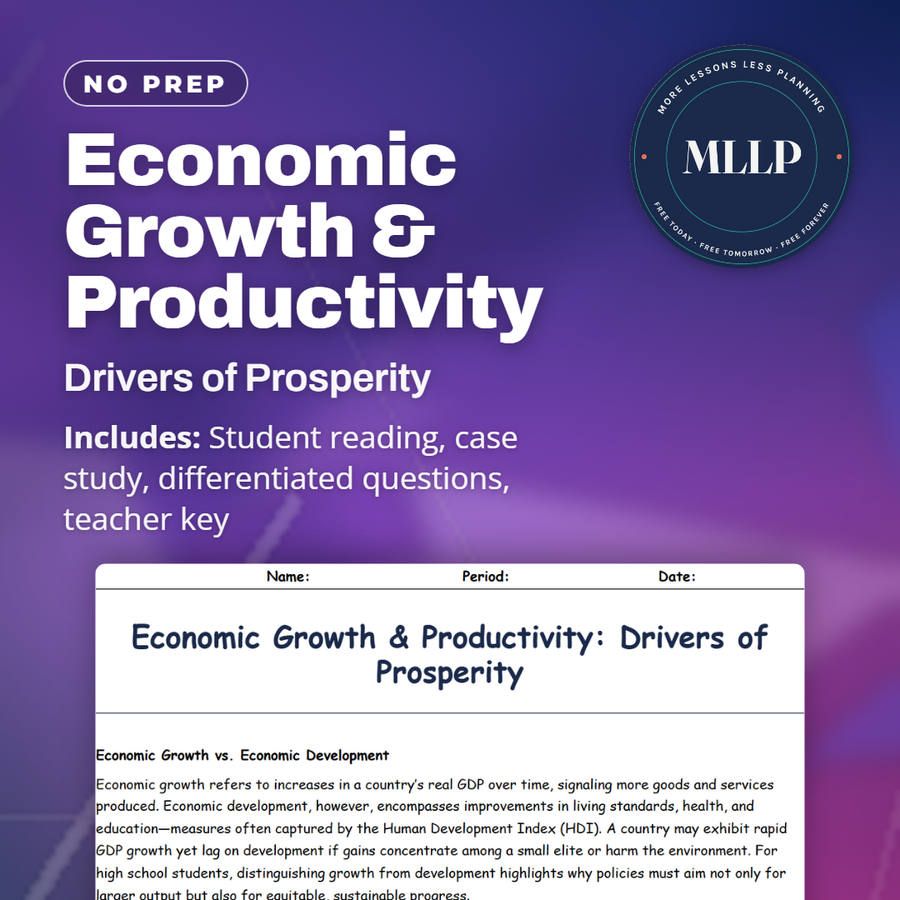
Economic Growth & Productivity: Drivers of Prosperity
Quality reviewed September 2026
Facts verified September 8, 2026
- Grades
- Grades 9-12
- Length
- 6-page student worksheet
- Time
- About one 50-minute class period
- Great for
- Sub plans and independent work
- Includes
- Reading passage, comprehension questions + full answer key
- Format
- Print-and-go PDF
What students do
- Distinguish between economic growth (GDP increases) and economic development (living standards and HDI improvements)
- Analyze how labor productivity and capital deepening drive output per worker using manufacturing examples
- Study South Korea's rise from $100 GDP per capita in 1954 to $10,000 by 1995 through education and industrial policy
- Calculate and explain Total Factor Productivity as GDP growth minus contributions from labor and capital
What it covers
- Sources of productivity including labor quality, capital investment, and technological innovation
- Total Factor Productivity and how efficiency gains arise from ideas and management practices
- Policies that support long-term growth including education, infrastructure, and R&D incentives
Start reading this worksheet
Economic Growth vs. Economic Development
Economic growth refers to increases in a country’s real GDP over time, signaling more goods and services produced. Economic development, however, encompasses improvements in living standards, health, and education, measures often captured by the Human Development Index (HDI). A country may exhibit rapid GDP growth yet lag on development if gains concentrate among a small elite or harm the environment. For high school students, distinguishing growth from development highlights why policies must aim not only for larger output but also for equitable, sustainable progress.
Sources of Productivity: Labor and Capital
Productivity, the output per unit of input, is the engine of growth. Labor productivity improves as workers become more skilled or as the number of hours worked yields greater output through training and technology. Capital deepening, where firms invest in machinery and infrastructure, boosts output per worker. For example, adding high-speed manufacturing robots can allow a single employee to oversee many more production steps. Both labor and capital require supportive institutions: secure property rights, efficient markets, and access to credit encourage firms and individuals to innovate and invest in productivity enhancements.
Total Factor Productivity and Innovation
Beyond labor and capital lies Total Factor Productivity (TFP), the efficiency with which all inputs combine. TFP gains arise from technological innovation, better management practices, and economies of scale. Consider the digital revolution: improvements in information technology have enabled exponential gains in TFP by automating tasks and facilitating global coordination. Measuring TFP involves comparing actual GDP growth to that predicted by labor and capital increases: TFP growth = GDP growth – (α·labor growth + (1–α)·capital growth), where α is labor’s share of income. High schoolers can see that TFP captures “the magic” of ideas and know-how turning inputs into greater outputs.
Like what you read? The full reading, the case study, and every question set are in the free download below, along with the answer key.
Why this matters
South Korea's income per person rose from about $100 a year in 1954 to $10,000 by 1995, while literacy climbed from 22 percent to 93 percent. Growth like that isn't luck. It comes from decisions: what one worker can produce once a factory adds machinery, and how much a country invests in teaching people to do more with less.
Students tend to treat national wealth as something a country either has or doesn't, like weather. I have them trace how machinery changes what one worker can produce, then apply that same logic to a whole economy. Productivity turns into a set of choices instead of luck.
From one teacher to another
I use this reading when teaching why some countries prosper while others stagnate, focusing on what drives productivity. Students read about how adding machinery to a factory floor lets one worker oversee more production steps, then examine South Korea's transformation: literacy rates climbing from 22% in 1945 to 93% by 1980, and coordinated investment in textiles, shipbuilding, and electronics. The worksheet asks students to identify which three policy areas mattered most (human capital, industrial planning, open trade) and to explain why export-driven growth pushed firms to adopt new technologies. Students fill in blanks about labor and capital contributions to growth, match terms like capital deepening and R&D investment to their roles, and answer short-response questions about why human capital investment pays long-term dividends even when growth slows.
What you get
- Answer Key
-
Student Worksheet
President Park Chung-hee's five-year economic plans directed money into textiles, shipbuilding, and electronics while a new Korea Development Institute coordinated the strategy. From 1960 to 1990 the country's real GDP grew at an average of 8.4 percent a year, and the reading credits roughly 40 percent of that growth to productivity gains, not to more workers or machinery.
Download
Where should I send the next one?
Everything here is free and it stays that way. Leave your email and I'll send you the new lessons as they go up. You can unsubscribe from any one of them.
Related resources

Business Cycles Demystified: Boom, Bust, and Recovery
GDP Explained: Understanding the Economy’s Core Metric

Key Economic Indicators: Signals of Market Health

Stability Factors: What Keeps the Economy Steady?
Trade Balance Impact: How Exports and Imports Shape GDP
Unemployment Uncovered: Rate and Labor Force Insights
Every lesson on this site is free to download and use. If one of them saved you a prep period, you can chip in a few bucks toward my three kids' daycare fund. That's genuinely where tips go.