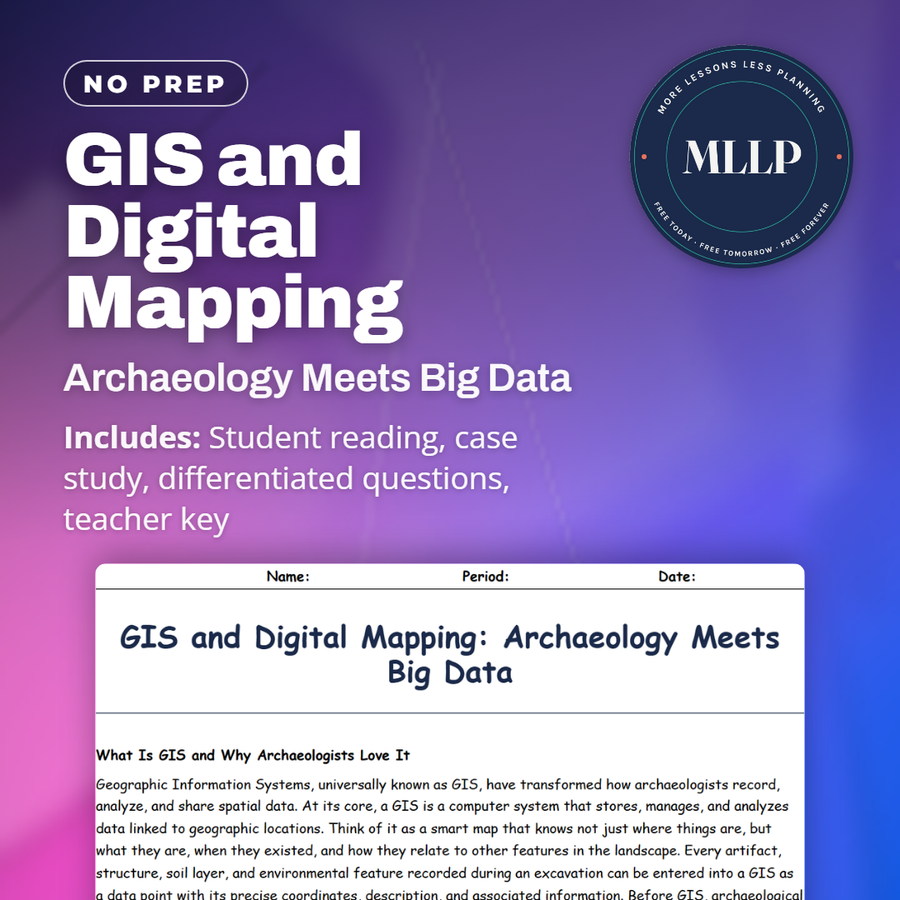
GIS and Digital Mapping: Archaeology Meets Big Data
Quality reviewed September 2026
Facts verified September 21, 2026
- Subject
- Social Studies
- Grades
- Grades 9-12
- Length
- 9-page student worksheet
- Time
- About one 50-minute class period
- Great for
- Sub plans and independent work
- Includes
- Reading passage, comprehension questions + full answer key
- Format
- Print-and-go PDF
What students do
- GIS layers get explained, from artifact locations to GPR surveys to LiDAR elevation data stacked on one digital map
- Fill in three blanks on georeferencing, cultural resource management, and Open Context
- Three short-answer questions cover spatial analysis, predictive modeling's limits, and open-access data sharing
- Trace how a highway planner reroutes construction after a predictive model flags a Riverside site
What it covers
- GIS layers, georeferencing, and spatial analysis in archaeology
- Predictive modeling for undiscovered sites
- Cultural resource management and rerouting a highway around a village site
Start reading this worksheet
What Is GIS and Why Archaeologists Love It
Geographic Information Systems, universally known as GIS, have transformed how archaeologists record, analyze, and share spatial data. At its core, a GIS is a computer system that stores, manages, and analyzes data linked to geographic locations. Think of it as a smart map that knows not just where things are, but what they are, when they existed, and how they relate to other features in the landscape. Every artifact, structure, soil layer, and environmental feature recorded during an excavation can be entered into a GIS as a data point with its precise coordinates, description, and associated information. Before GIS, archaeological site maps were drawn by hand on paper, and the data from different sites existed in separate notebooks, filing cabinets, and published reports. Comparing the spatial patterns of artifacts from one site to another required physically laying maps side by side and eyeballing the differences. GIS changed all of that by putting everything into a single digital environment where layers of information can be combined, compared, and analyzed with computational power that would have been unthinkable a generation ago. Modern GIS software allows archaeologists to overlay multiple types of data on the same map: the locations of artifacts, the boundaries of stratigraphic layers, the results of geophysical surveys like GPR and magnetometry, elevation data from LiDAR, historical maps, aerial photographs, and even satellite imagery. By toggling these layers on and off, researchers can spot patterns and relationships that would be invisible in any single dataset. A GIS might reveal, for example, that all the sites in a region with a particular type of pottery are located within a kilometer of a river, suggesting that the pottery was distributed by river trade.
Building a Digital Map of the Past
The process of creating an archaeological GIS begins with georeferencing, which means assigning real-world geographic coordinates to every data point. During excavation, the position of every significant find is recorded using instruments like total stations or GPS units, which can measure positions to within a few centimeters. This data is then imported into the GIS along with associated information: what was found, what layer it came from, its condition, its date, and any other relevant details. The result is not just a map but a database that can be queried and analyzed. An archaeologist might ask the GIS to show all bronze objects from a particular century, or all hearths within fifty meters of a water source, or all sites where a specific pottery type has been found. The GIS retrieves the relevant data points and displays them on the map, allowing the researcher to see spatial patterns that might not be apparent from looking at the raw data in a spreadsheet. GIS also enables spatial analysis, which uses mathematical and statistical methods to identify meaningful patterns in geographic data. Nearest-neighbor analysis can determine whether artifacts are clustered, dispersed, or randomly distributed. Viewshed analysis can calculate what was visible from any given point in the landscape, which is useful for understanding why defensive sites were placed where they were. Cost-surface analysis can model the easiest routes through a landscape, helping archaeologists predict where ancient roads and trails might have run. These analytical capabilities make GIS far more than a fancy mapping tool. It is a research instrument that generates new hypotheses and answers questions that could not have been asked before the technology existed. When archaeologists say that GIS has changed their discipline, they do not just mean that their maps look nicer. They mean that GIS has changed the kinds of questions they can investigate and the kinds of answers they can find.
Predicting Where Sites Are Hidden
One of the most powerful applications of GIS in archaeology is predictive modeling. By analyzing the locations of known archaeological sites in relation to environmental features like water sources, soil types, elevation, slope, and vegetation, GIS can identify areas with similar characteristics where undiscovered sites are likely to exist. This approach, sometimes called predictive modeling or archaeological sensitivity mapping, helps archaeologists and land managers focus their survey efforts on the areas most likely to contain sites. Predictive models have proven remarkably effective. In the Netherlands, GIS models predicted the locations of buried Neolithic and Bronze Age sites in the Rhine-Meuse delta with accuracy rates above 80 percent. In the American West, predictive models have guided survey crews to previously unknown pueblo sites by identifying terrain with the right combination of water access, arable soil, and defensive position. Even in urban settings, predictive models have helped city planners anticipate where construction projects are likely to encounter archaeological remains. The approach is not without controversy. Some archaeologists argue that predictive models are inherently biased because they are based on the locations of already-known sites, which may not represent the full range of past human activity. If ancient people sometimes settled in unexpected locations, those sites would never be predicted by a model trained on typical settlement patterns. There is also a concern that over-reliance on predictive models could lead to under-surveying areas that the model rates as low probability, potentially missing important sites. Despite these debates, predictive modeling has become an essential tool in cultural resource management, the branch of archaeology that deals with protecting sites from destruction by development. When a highway, pipeline, or housing development is planned, CRM archaeologists use GIS models to identify which portions of the project area are most likely to contain archaeological sites, allowing them to target their limited survey time and budget where it will do the most good.
Like what you read? The full reading, the case study, and every question set are in the free download below, along with the answer key.
Why this matters
The highway case study is really a story about a decision made before anyone broke ground, and that is where GIS earns its keep. Development happens constantly near where people used to live, and a database that flags high-probability ground can be the difference between a village site getting documented and it getting paved over without anyone noticing. The reading also names a real tension worth discussing: a predictive model can only see patterns in sites we already know about, so it can just as easily miss the settlement that does not fit the usual pattern, which is a limitation of any tool built from past data rather than a flaw unique to archaeology.
From one teacher to another
Before GIS, an archaeologist comparing two site maps had to lay paper side by side and eyeball the differences, and this reading opens by explaining what changed. A GIS ties every artifact, wall, and soil sample to exact coordinates, then lets researchers stack layers like LiDAR elevation and GPR results on the same digital map. Predictive modeling takes that a step further: by studying where known sites tend to sit, near water, on well-drained soil, on a gentle slope, a GIS can flag land that probably holds sites nobody has found yet. That approach is not universally loved, since a model trained only on known sites can miss anything built somewhere unexpected. The case study puts the idea to work: city planner Tomoko Hayashi uses a sensitivity map to catch a buried village before Highway 47 bulldozes through it, then shifts the route three hundred meters to avoid it.
What you get
Download
Where should I send the next one?
Everything here is free and it stays that way. Leave your email and I'll send you the new lessons as they go up. You can unsubscribe from any one of them.
Related resources
3D Scanning and Virtual Archaeology

Beyond Carbon: Other Ways to Date the Past
Dating and Detection: The Science Behind Archaeology

Ground-Penetrating Radar: X-Ray Vision for Dirt

LiDAR: Seeing Through the Jungle from the Sky

Pottery Analysis: Why Broken Pots Are an Archaeologist's Best Friend
Every lesson on this site is free to download and use. If one of them saved you a prep period, you can chip in a few bucks toward my three kids' daycare fund. That's genuinely where tips go.