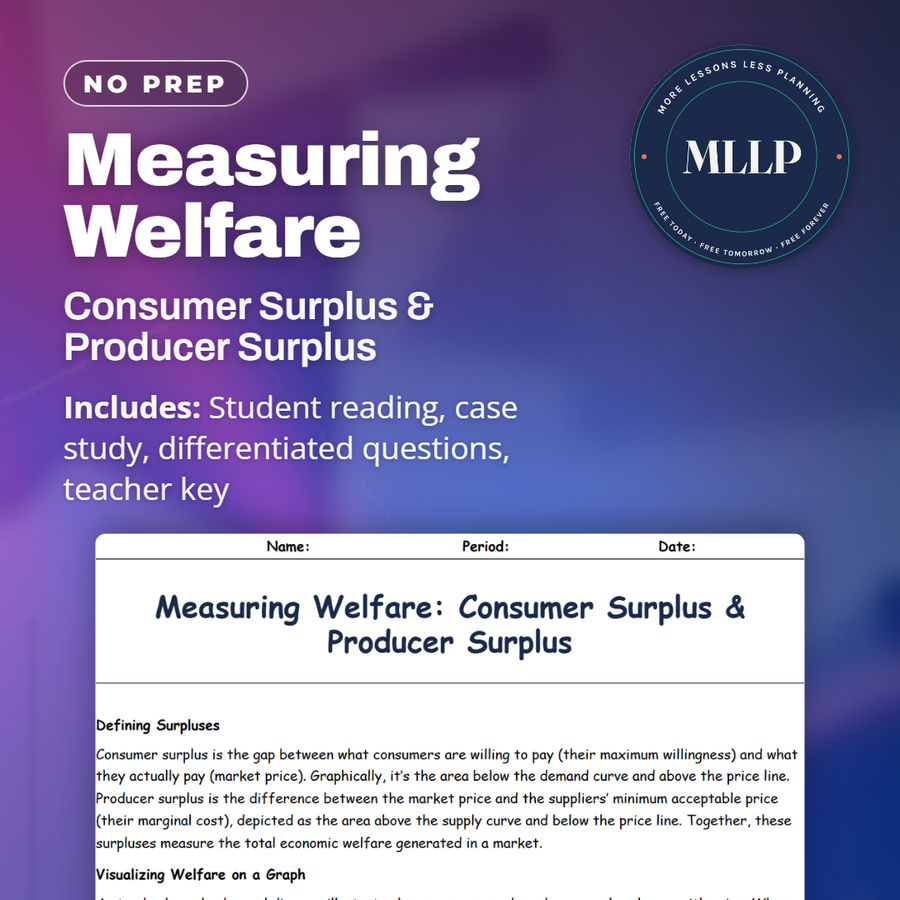
Measuring Welfare: Consumer Surplus & Producer Surplus
Quality reviewed September 2026
Facts verified September 8, 2026
- Grades
- Grades 9-12
- Length
- 6-page student worksheet
- Time
- About one 50-minute class period
- Great for
- Sub plans and independent work
- Includes
- Reading passage, comprehension questions + full answer key
- Format
- Print-and-go PDF
What students do
- Analyze the SweetBrew City case study, where a 50-cent per-can tax raised the consumer price from $1.50 to $1.80 and cut the quantity sold
- Explain why producer surplus falls when a per-unit tax is imposed
- Match terms like consumer surplus, producer surplus, deadweight loss, tax revenue, and per-unit subsidy to their definitions
- Weigh the welfare loss from the sugary drink tax against the health benefits it was designed to deliver
What it covers
- What consumer surplus and producer surplus measure and how to see them on a graph
- How taxes and subsidies move welfare between buyers, sellers, and the government
- Price controls and policy trade-offs, anchored by a sugary drink tax case study
Start reading this worksheet
Defining Surpluses
Consumer surplus is the gap between what consumers are willing to pay (their maximum willingness) and what they actually pay (market price). Graphically, it’s the area below the demand curve and above the price line. Producer surplus is the difference between the market price and the suppliers’ minimum acceptable price (their marginal cost), depicted as the area above the supply curve and below the price line. Together, these surpluses measure the total economic welfare generated in a market.
Visualizing Welfare on a Graph
A standard supply–demand diagram illustrates how consumer and producer surplus change with price. When a market is in equilibrium, the sum of consumer surplus (triangle above price) and producer surplus (triangle below price) is maximized. Any policy or shock that shifts supply or demand or imposes a tax/subsidy alters these areas, creating deadweight loss—the lost welfare from trades that no longer occur. This table clarifies how to locate each welfare component on the graph and interpret its meaning.
Impact of Taxes and Subsidies
A per-unit tax on sellers shifts the supply curve upward by the tax amount, raising prices and reducing quantity. Consumers pay higher prices, shrinking consumer surplus; producers receive lower net prices, shrinking producer surplus; and the government collects tax revenue (a rectangle between price paid and price received). However, some potential trades vanish, creating deadweight loss. Conversely, a subsidy shifts supply downward, expanding quantity and increasing total surplus, though at the taxpayer’s expense.
Like what you read? The full reading, the case study, and every question set are in the free download below, along with the answer key.
Why this matters
A can that cost a dollar fifty now costs a dollar eighty in SweetBrew City, thanks to a fifty-cent per-can tax, and that gap is where the whole idea of surplus lives. Some of it becomes tax revenue the city can spend, some of it is deadweight loss that just disappears, and telling the two apart is the first time most students read a dollar amount off the shape of a graph instead of a receipt.
The question I always end on is whether the health benefit was worth the welfare lost, and it splits the room every time. Kids who play sports care about the health angle. Kids who buy a soda every day at lunch care about the fifty cents added to every can. Neither side is wrong, which is exactly why this topic earns the argument instead of a quick answer.
From one teacher to another
Surplus is the first place my students have to read areas off a graph, so I want the numbers simple and the story concrete. The SweetBrew City soda tax gives them both: a clean 50-cent tax, a price that lands at $1.80, and a quantity that visibly shrinks. Students trace where the lost welfare goes, how much becomes tax revenue, and what evaporates as deadweight loss. The closing question, whether the health gains justify the welfare cost, always gets the class talking. The answer key keeps grading fast.
What you get
- Answer Key
-
Student Worksheet
SweetBrew City's fifty-cent tax cut annual sales from 100 million cans to 80 million, and the lost welfare split three ways, with $40 million becoming tax revenue, consumer surplus falling $25 million, and producer surplus dropping $20 million, leaving $5 million as pure deadweight loss. Researchers later credited the lower consumption with preventing 2,000 obesity related hospitalizations, worth about $10 million in societal benefit.
Download
Where should I send the next one?
Everything here is free and it stays that way. Leave your email and I'll send you the new lessons as they go up. You can unsubscribe from any one of them.
Related resources

Ceilings & Floors: When Prices Can’t Find Their True Level

Elastic or Inelastic? Mastering Price Elasticity of Demand
Finding Balance: Market Equilibrium and Price Discovery
Markets & the State: Government’s Role in Supply and Demand
Supply Unveiled: How Sellers Decide What to Produce

Supply’s Sensitivity: Understanding Price Elasticity of Supply
Every lesson on this site is free to download and use. If one of them saved you a prep period, you can chip in a few bucks toward my three kids' daycare fund. That's genuinely where tips go.