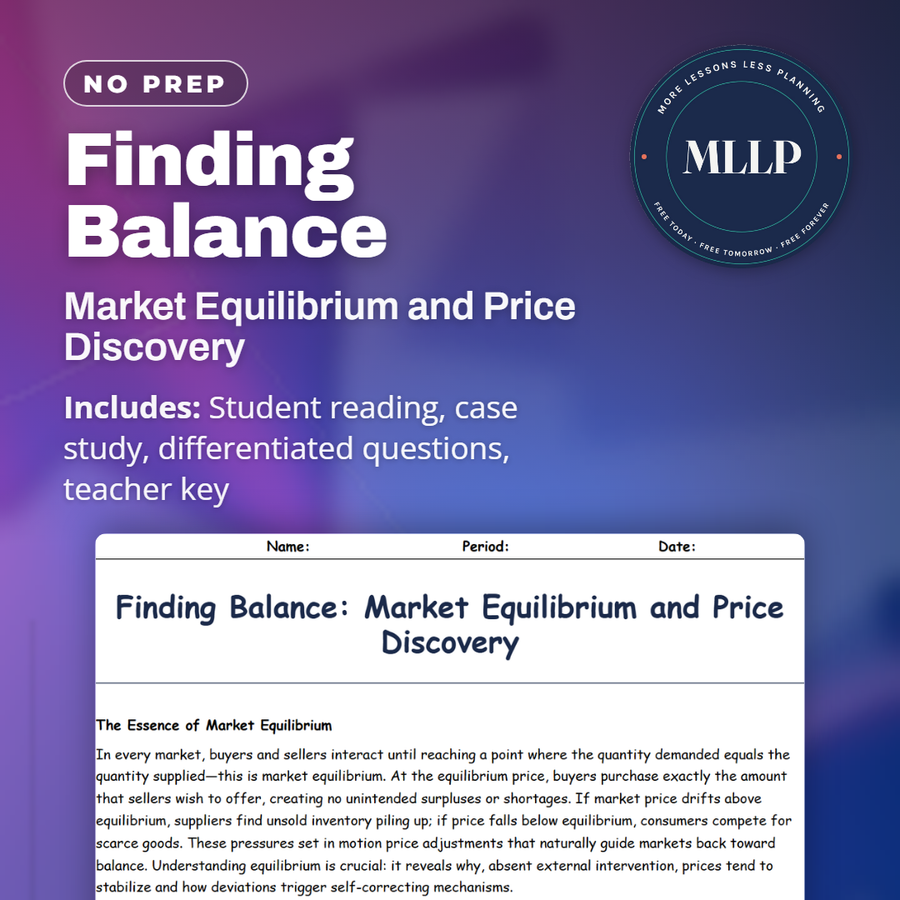
Finding Balance: Market Equilibrium and Price Discovery
Quality reviewed September 2026
Facts verified September 8, 2026
- Grades
- Grades 9-12
- Length
- 8-page student worksheet
- Time
- About one 50-minute class period
- Great for
- Sub plans and independent work
- Includes
- Reading passage, comprehension questions + full answer key
- Format
- Print-and-go PDF
What students do
- Analyze the QuickRide case study, where a dynamic fare algorithm balanced riders and drivers using real-time supply and demand data
- Describe how surge pricing pulled more drivers into busy zones during a concert rush
- Match terms like dynamic pricing, auction, price floor, and movement along the curve to their definitions
- Explain how shortages and surpluses push prices back toward equilibrium
What it covers
- What market equilibrium is and how prices move toward it
- Shortages, surpluses, and the market responses they trigger
- Price discovery mechanisms, from auctions to ride-hail surge pricing algorithms
Start reading this worksheet
The Essence of Market Equilibrium
In every market, buyers and sellers interact until reaching a point where the quantity demanded equals the quantity supplied. That point is market equilibrium. At the equilibrium price, buyers purchase exactly the amount that sellers wish to offer, creating no unintended surpluses or shortages. If market price drifts above equilibrium, suppliers find unsold inventory piling up; if price falls below equilibrium, consumers compete for scarce goods. These pressures set in motion price adjustments that naturally guide markets back toward balance. Understanding equilibrium is crucial: it reveals why, absent external intervention, prices tend to stabilize and how deviations trigger self-correcting mechanisms.
Shortages, Surpluses, and Market Responses
A shortage occurs when price sits below equilibrium. Quantity demanded then outstrips quantity supplied. Consumers, unable to secure desired items, bid up prices; higher prices then both dampen demand and encourage suppliers to increase output. Conversely, a surplus arises when price lies above equilibrium. Quantity supplied then exceeds demand. Sellers, struggling to move excess inventory, cut prices, which increases demand and tempers supply. This dance of price and quantity continues until the market clears. This table clarifies how both sides adjust: consumers react to shortages by accepting higher prices, while producers respond to surpluses by lowering prices or scaling back. The result? A return to equilibrium.
Price Movements Along Curves
Economists depict these dynamics on a single graph: the demand curve (downward sloping) and the supply curve (upward sloping). A shortage triggers an upward movement along the supply curve (higher price, greater quantity supplied) and a leftward movement along the demand curve (higher price, lower quantity demanded). A surplus produces the reverse movements. These price movements along curves (not shifts of the curves themselves) reflect responses to price deviations while non-price factors remain constant. Mastering this concept equips you to interpret real-time market signals, such as rapidly rising auction bids or clearance pricing in retail.
Like what you read? The full reading, the case study, and every question set are in the free download below, along with the answer key.
Why this matters
A ride-hail fare that climbs the moment a concert lets out looks like price gouging until you watch what it actually does: pull more drivers into that exact neighborhood within minutes. QuickRide's algorithm is reading the same signals a corner market reads over weeks, just compressed into the time it takes a crowd to clear a venue.
I use this reading right after the static supply and demand graphs, because students have drawn intersecting lines for days without quite believing a market moves toward that point on its own. Surge pricing gives them a case where the adjustment happens fast enough to watch, and shortages and surpluses stop being arrows on a diagram.
From one teacher to another
I use this reading to move students from static supply and demand graphs to prices that adjust in real time. The QuickRide case study lands because most of them have watched a ride-hail fare climb on a busy night. They trace how the algorithm reads driver counts, ride requests, and traffic, then nudges fares so the number of riders matches the number of cars. That is equilibrium happening in minutes instead of on a chalkboard. The question set and answer key round it out for homework or a sub day.
What you get
- Answer Key
-
Student Worksheet
During an unexpected subway strike, QuickRide's algorithm preemptively raises fares in affected areas before wait times spike, drawing on weather and transit-delay data added after its 2021 launch. Wait times fall 40% and driver earnings rise 25% against static-fare weekends, while its response to an earlier post-concert crowd moved fares up 60%, trimming rider demand 25% and pulling 30% more drivers into the surge zone within 15 minutes.
Download
Where should I send the next one?
Everything here is free and it stays that way. Leave your email and I'll send you the new lessons as they go up. You can unsubscribe from any one of them.
Related resources

Ceilings & Floors: When Prices Can’t Find Their True Level

Elastic or Inelastic? Mastering Price Elasticity of Demand
Markets & the State: Government’s Role in Supply and Demand
Measuring Welfare: Consumer Surplus & Producer Surplus
Supply Unveiled: How Sellers Decide What to Produce
Supply’s Sensitivity: Understanding Price Elasticity of Supply
Every lesson on this site is free to download and use. If one of them saved you a prep period, you can chip in a few bucks toward my three kids' daycare fund. That's genuinely where tips go.