The Stock Market - How It Works and Why It Moves
Activity (Student)
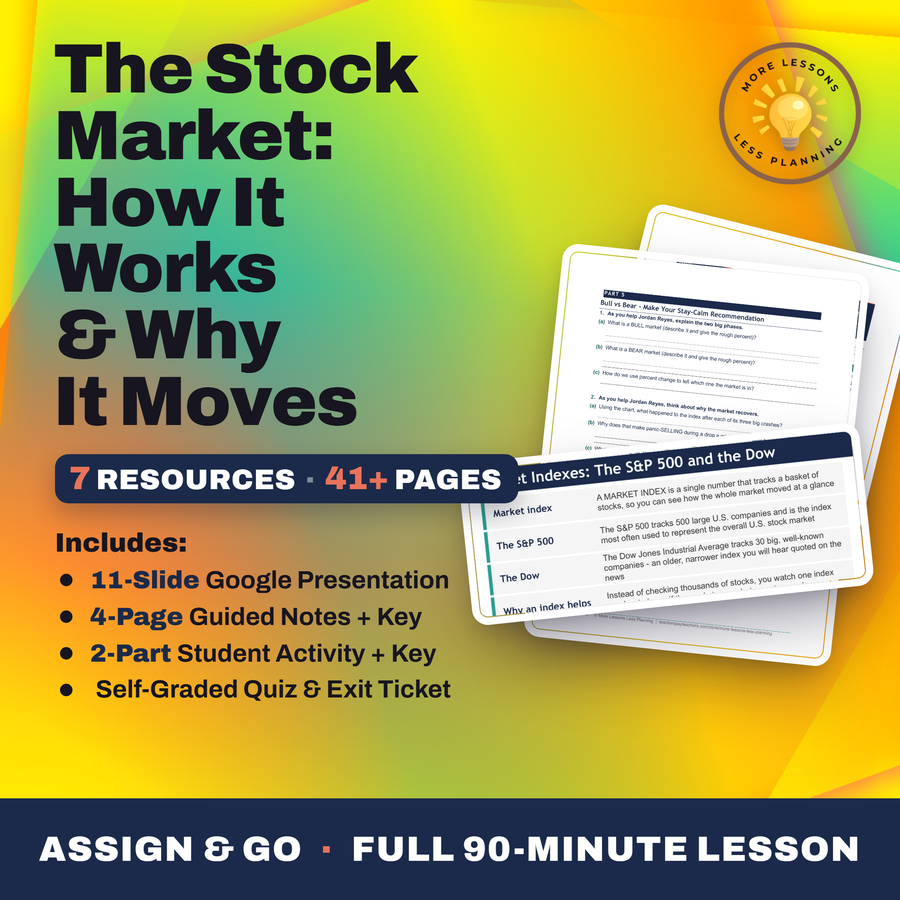
A 25-year index chart carries Jordan Reyes from the 2002 dip through 2009's low of about 750 up to 2025, and the same percent-change formula that sizes a single stock's jump from $50 to $58 measures how deep that 2009 crash really was.
Download the Activity (Student)
Word (.docx)
Where should I send the next one?
Everything here is free and it stays that way. Leave your email and I'll send you the new lessons as they go up. You can unsubscribe from any one of them.
Did this save you a prep period? You can chip in toward my three kids' daycare fund. Everything on this site stays free either way.