

The Stock Market - How It Works and Why It Moves
- Slide deck
- Guided notes
- Guided notes teacher key
- Activity + answer key
- Quiz + answer key
- Exit ticket + answer key
- Teacher guide
- Teacher presentation notes
Where should I send the next one?
Everything here is free and it stays that way. Leave your email and I'll send you the new lessons as they go up. You can unsubscribe from any one of them.
Every file in this toolkit
Related resources

Bonds - Lending to Governments and Companies

Risk vs Reward - Why You Can't Win Without Risk

Why Save - The Power of Starting Young
Financial Goals - Short, Medium and Long Term
Health Insurance - The Most Confusing Bill You'll Get
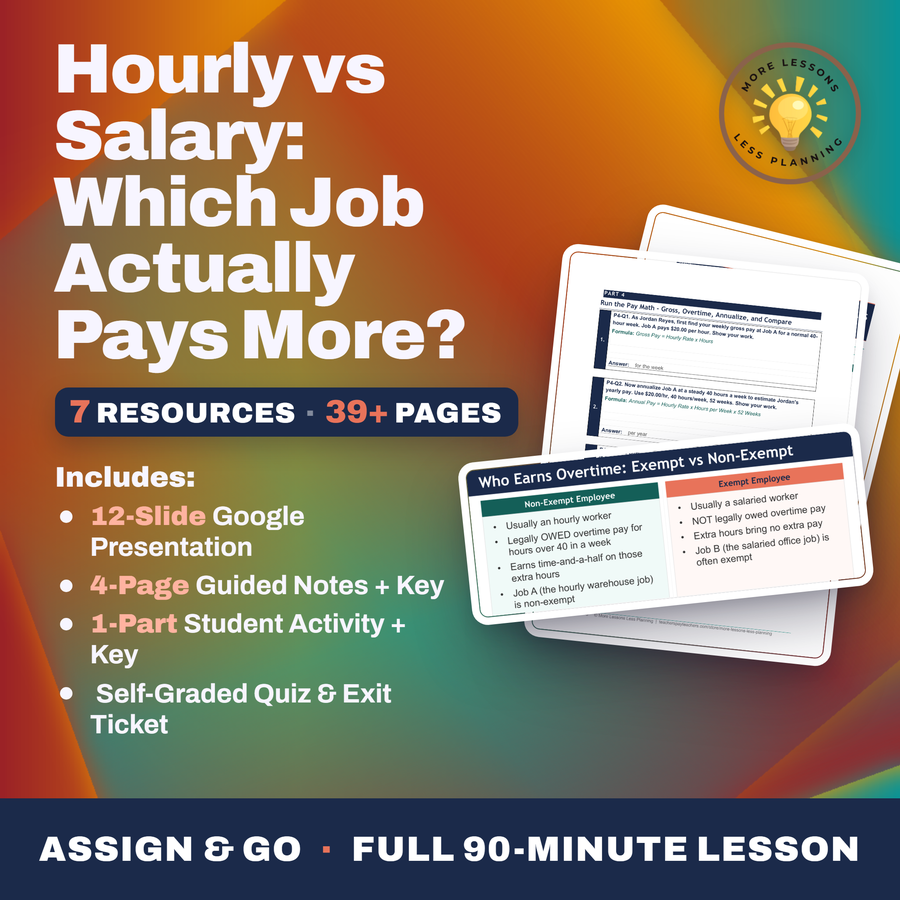
Hourly vs Salary: Which Job Actually Pays More?
What students do
- Trace a 25-year market index chart through three separate crashes and recoveries
- Calculate percent change on a stock price move using the new-minus-old formula
- Explain how supply and demand push a price up or down after an earnings report
- Argue why a long-term investor should stay invested through a bear market
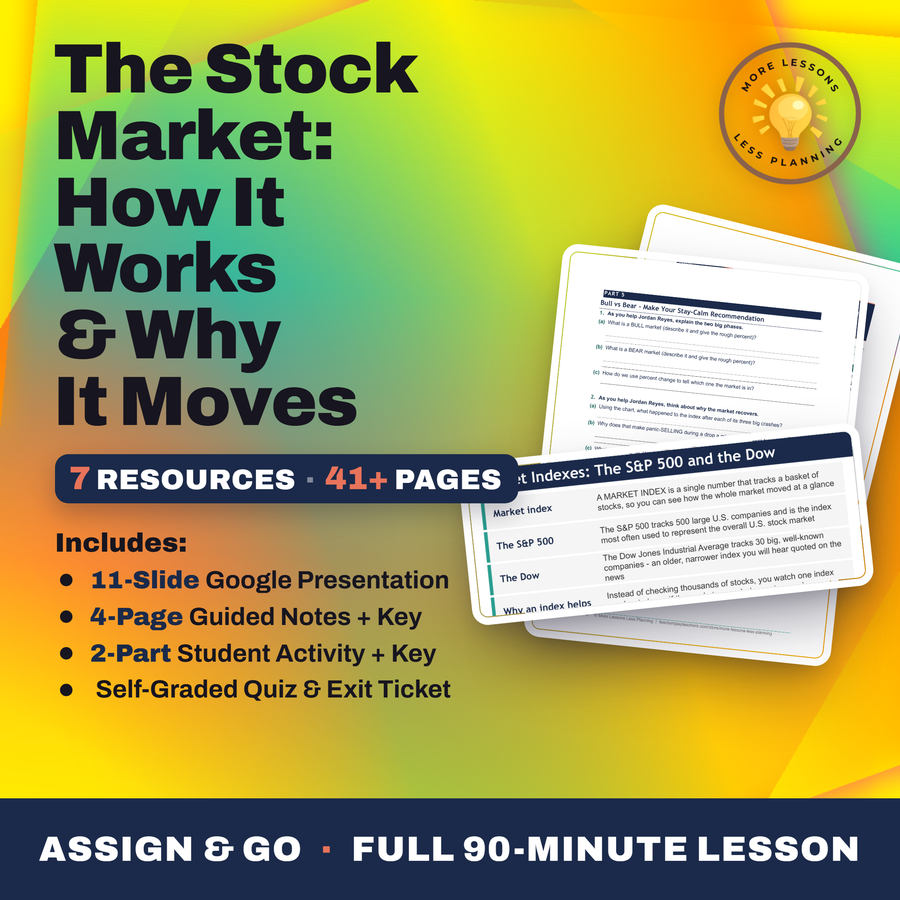
What it covers
- How stock exchanges like the NYSE and Nasdaq match buyers and sellers
- Supply and demand as the force that sets every stock price
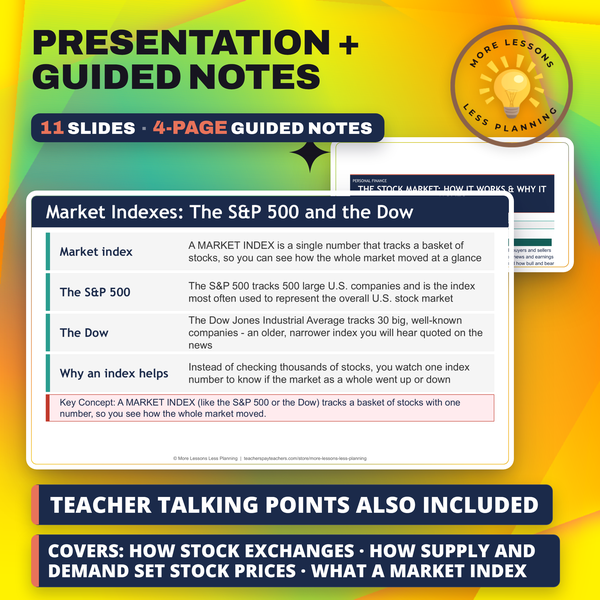
- Market indexes like the S&P 500 and the Dow as a scoreboard for the whole market
- The difference between a bull market and a bear market, measured in percent change
Learning targets
- Explain how stock exchanges (like the NYSE and Nasdaq) work to match buyers and sellers
- Explain how supply and demand set stock prices and why prices move on news and earnings
- Describe what a market index (like the S&P 500 or the Dow) measures and how bull and bear markets differ
- Use percent change ((new - old) / old) x 100 to size a market move, and explain why a long-term investor stays calm when the market drops
From one teacher to another
I wanted students to see the market's actual shape instead of just hearing "it goes up over time," so this one hands them a 25-year chart with the dot-com bust, 2008, and the 2020 dip built right in. They calculate the size of each crash themselves with the same percent-change formula, which makes the final argument, that panic-selling locks in a loss, land as math instead of a lecture. It's the lesson I most want students to still remember the first time their own account drops.
Every lesson on this site is free to download and use. If one of them saved you a prep period, you can chip in a few bucks toward my three kids' daycare fund. That's genuinely where tips go.